Monetizing Permian basin well data to optimize infill completions
As operators continue to navigate the new economic normal, the demand for greater efficiency from investors continues to be the number one priority. Investors are asking for the immediate monetization of completions data, the booking of more robust reserves, and the generation of free cash flows. The industry has never shied away from the task at hand; actually, the industry seems to come out ahead when, at first glance, the challenge seemed overwhelming. The impressive contributions of companies and individuals that reshaped the U.S. energy landscape from net importer to net exporter, through the advancement of horizontal drilling and hydraulic fracturing, is a leading example of a challenge accepted and overcome.
In this newest era of challenge, which requires operators to do more with less, there may be at least one meaningful silver lining: As the call for efficiency grows louder, the tools to increase efficiency become more abundant and mature. The exponential growth of digitalization, or the use of digital technologies to provide greater insights that yield incremental value opportunities, is driving a shale renaissance within the unconventional O&G industry. These new technologies allow operators to collect more data than ever before, with some industry experts labeling this paradigm a tsunami of data.
There are substantive learnings in the data, if the right digital technologies are applied to extract the information in near-real time or, certainly, before completing the next pad. Operators can gain insights into key parameters, including vertical and lateral well spacing, job size, and zipper fracing sequence order. In the Permian basin, for example, an operator applied a new digital technology to transform well data into actionable knowledge with the most immediate, positive effect on the stimulation job. The ORCHID* completions interpretation platform enabled the operator to monetize three infill wells’ completion data into actionable business outcomes that ultimately yielded a significant reduction in stage completions costs, informed future well spacing, and optimized multi-bench development strategies. These performance improvements enabled the operator to unlock and generate additional free cash flows and book additional reserves across the inventory of uncompleted wells within the asset.
PURPOSE-BUILT FOR COMPLETION ENGINEERS
ORCHID is the first comprehensive completions diagnostics data interpretation platform built by engineers, for completion engineers, to accelerate the monetization of diagnostics investments. The platform efficiently and robustly understands the most ubiquitous measurements, such as treatment breakdown, net pressure, and initial shut-in pressures (ISIPs) to more exotic measurements, including distributed acoustic strain (“DAS”), or temperature-sensing fiber(s) installed permanently or run off wireline to capture cross-well strain, microseismic, or production flowback monitoring.
ORCHID also streamlines the cumbersome, yet fundamentally necessary, task of data loading, data quality control and cleansing, and normalization, to understand the underlying relationships in the data and, finally, to value discovery through specific actions and recommendations. A Permian basin stacked pay case study describes how ORCHID transforms well data into actionable knowledge. ORCHID is designed specifically for integrating and analyzing completion and diagnostic data, to provide rapid insights into the efficacy of completion designs and allow data-driven decisions for improving field performance and optimizing overall development cost.
STACKED INFILL WELLS DIAGNOSTICS CASE STUDY
A single four-well pad has two pay zones separated by 250 ft vertically. The primary parent well, (P1) located in the lower bench and which had been on production for the previous 12 months, had a highly aggressive completion design, engineered to maximize the initial output rate. Two new infill wells in the upper bench (C2 and C3), and a single new well in the lower bench (C1), will be completed. The primary well completion was not designed to maximize overall unitized resources recovery, nor to mitigate production interference with the three infill or child wells. The new child wells included a variety of completion design control parameters to optimize the unit development plan, as shown in Table 1.
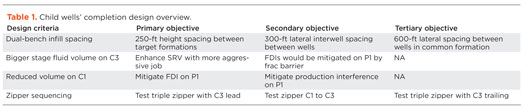
The operator’s goal was to determine the efficacy of a dual-bench infill program with 250-ft vertical bench spacing and 600-ft absolute in common pay-zone transverse spacing. The operator tested significantly larger fluid and proppant loading on the C3 well, with the goal of enhancing the total stimulated surface area. The original design premise was based on a competent lithological barrier to pressure communication between the layers and subsequent production interference between the two benches. The operator further experimented with reduced stage volumes on the C1 well completion to mitigate fracture-driven interactions (FDIs) on the P1 well.
The final, yet equally important, test on this pad was the optimization of the staggered zipper sequence. The base design had well C3 leading the other two wells. Optional zipper sequences consisting of C2 leading a two-well zipper, and a triple zipper with C3 trailing, were considered as potential options. The zipper sequence would be measured, informed, and adjusted, based on the near-real time analysis of diagnostic data, as detailed in a later section of this article.
DATA LOADING, QC, AND DATA FUSION
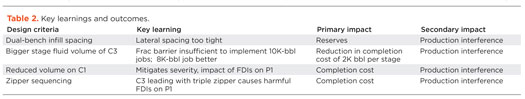
A comprehensive diagnostic program was established with surface and downhole offset pressure monitoring data: downhole microseismic, tracers, FDIs, and production data. This diagnostic program resulted in more than 200 input data files from multiple vendors. Each vendor had a proprietary data format and naming conventions, posing a challenge of sorting and assembling the information into one coherent data set. Existing software tools, primarily spreadsheets, proved incapable of handling this task in a timely and efficient manner. All available data were loaded into the ORCHID platform within 1 hr. Figure 1 shows the various diagnostic data visualized along the well trajectories.
After loading, the data must be quality-controlled and corrected for any errors. This project occurred during the transition of daylight savings time. The offset pressure monitoring and microseismic data were captured in UTC time, whereas the stimulation treatment, surface casing pressure and temperature, and tracer data were recorded in local time. The pressure pumping company did not account for daylight savings time. The ORCHID platform has robust modules that permit rapid data QC and make adjustments to correct and align the time across all input data. This step, alone, saved several hundred hours, compared with traditional analysis. This robust functionality also eliminates jumping back and forth between PDF post-job reports and spreadsheets with time-series stimulation treatment data and time-series offset pressure monitor data. The data analyst can now focus most of his or her effort on the data analysis.
Data loading and QC enable the next step of data fusion, in which multiple diagnostic data sources are linked in time and depth and cross-referenced, creating an integrated data structure. This structure allows the engineer to uncover trends and relations that are not present in the primary data source on their own. This insight is extremely important, as the most valuable lessons can be retrieved at the intersection of different data sources framing a common hypothesis or thesis. The example below will detail how ORCHID data fusion allowed the insight into the completion design performance and quick determination of next steps and actions to be taken on subsequent pads.
ISIP AND NET PRESSURE QC
ISIP analysis, which is essentially a free measurement made at the end of each stage, provides meaningful data to estimate changes and trends in minimum horizontal stress1 and, therefore, adds value to determine changes in stress anisotropy and potential formation/frac barrier breakthrough.2 ISIPs, typically, are computed by the pressure pumping engineer or an onsite engineering manager. The time window chosen for the analysis and method to compute ISIP varies quite significantly between engineers performing the analysis. This condition can make interpretation of ISIP data quite challenging or, worse, lead to an incorrect interpretation.
ORCHID provides a rapid, consistent and traceable method for the engineer to review and potentially QC and/or recompute an entire catalog of stage-level ISIPs from a package of wells in about an hour.
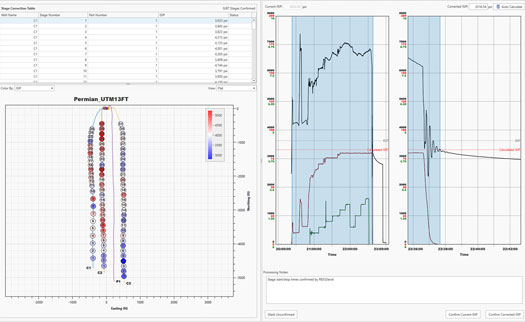
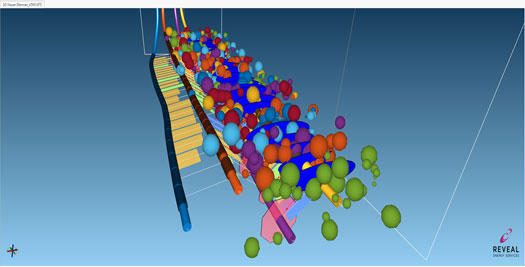
Figure 2 has a map view of computed ISIPs for all stages of the child wells, showimg that the ISIPs from the C3 are consistently lower than the ISIPs of the other two child wells, C1 and C2. This situation is significant in the stages toward the wells’ toe sections. This is contrary to expectations, because the C3 was separated from the parent well by a frac barrier. The lower ISIPs in the C3 can be explained by a non-isolating frac barrier that enabled fluid breakthrough between the C3 and the parent P1 well. Fluid communication between the C3 and P1 can explain the lower ISIPs observed on the C3. This fact was validated by comparing the FDI analysis results with the microseismic analysis. One challenge still remains to be answered: What was causing the breach of the frac barrier? Was it the larger C3 job size or the geologically weak frac barrier? This question will be answered through the ORCHID analysis.
RAPID ANALYSIS/CLASSIFICATION/ INTERPRETATION OF FDIs
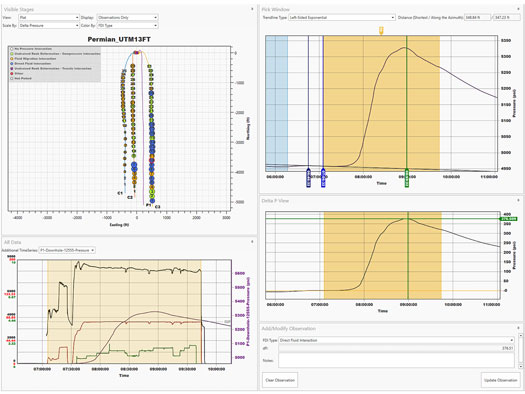
We now look at pressure analysis, one of the lowest-cost and most non-intrusive diagnostics measurements on a pad-based completion. We start with indexing and synchronizing each of the respective pressure sensor data streams to the appropriate local time within ORCHID. The operator now has the flexibility to do a comprehensive analysis on the observed FDIs. Within ORCHID, the operator can pull in any pressure and temperature data stream and interrogate that stream versus a corresponding stage or an entire well of stimulation data to appropriately analyze and classify a respective FDI signal type.
ORCHID lets the operator automatically pick the time interval of the onset or termination of each respective pressure signal (FDI type) of interest. Popular filtering and signal processing approaches, such as smoothing and Savitsky-Golay3 smoothing analysis of the pressure signal in the first and second derivative domain, are pre-programmed for ease of use.
ORCHID also lets the operator implement any customized or proprietary signal classification algorithm to perform offset pressure analysis. The operator also can define time windows within the stimulation data with any customized logic or proprietary classification algorithm to relate the pressure signals to periods or completion parameters of specific interest. ORCHID is an open interpretation platform, and the user can seamlessly apply his or her own pressure signal classification approaches directly inside of it or through an API linking any common analytical programming tool, such as Matlab, Python or Spotfire to the open source ORCHID iFrac file. Figure 3 shows an example of picking the signal magnitude and signal classification for a given stage being analyzed.
The complete FDI analysis for this four-well pad was completed within 15 min. by the data analyst, compared with several days required for traditional methods. ORCHID also extracts critical metadata automatically into a data-frame that carries the volume, proppant, or horsepower time and the associated unit costs for these respective parameters to the onset time interval of that pressure signal. No additional effort or steps have to be undertaken to compute the volume-to-response time or proppant-to-response time.
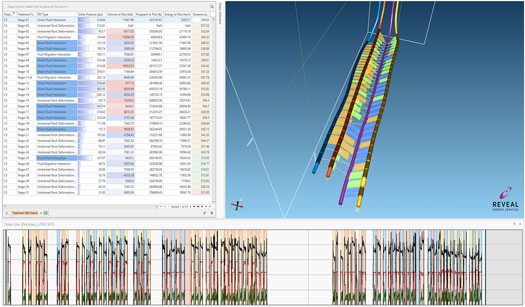
Figure 4 shows the magnitude of the FDIs observed at the parent well (P1) while completing every stage of the three child wells. Without additional data manipulation, the engineer can easily see that the magnitude of FDIs for stages 1–21 of C3 are significantly higher than the FDIs from corresponding stages of C1 and C2.
The next step is to look at the zipper fracing order and the job size to better understand the cause of the large FDI. ORCHID provides a visual method to pan through the data set—making it easy to observe the zipper fracing order. This functionality showed that C3 stages 1–21 always led the corresponding stages for wells C1 and C2. ORCHID also enabled a quick scan of the total fluid volumes pumped into each stage, showing that the C3 well had almost 25% more fluid volume than the corresponding stages of C1 and C2. This combination of larger fluid and proppant volume, combined with C3 leading the zippering sequence, has clearly ruptured the frac barrier and created the larger FDIs. The recommendation is to reduce the job size for future wells by 2,000 bbl per stage and change the fracing order to minimize the severity of FDIs between the upper and lower wells.
This recommendation was validated further by the microseismic and tracer data collected on the pad. The processed results confirm the interpretation from the FDI analysis and clearly show that the lithological barrier separating the upper and lower target formation was ruptured by the overly aggressive C3 stimulation design. Further, the operator captured tracers that showed significant returns of C3 stimulation fluids from the P1 well. With these two additional independent data sources, along with the FDI analysis telling a common story, it became evident to the operator that there was an immediate opportunity for significant cost-savings on the subsequent inventory of wells.
ORCHID analysis provided several key insights and actionable outcomes:
- Dual-bench in-fill well spacing: The key learning was that the lateral spacing of 600 ft within the common formation was too tight, and further that the intra-formation transverse spacing of 300 ft between the upper and lower wells was too close. The P1 depleted well consumed significant fluid and sand from the C3 well and imparted significant post-stimulation production interference.
- Effectiveness of frac barrier: The lithological barrier between the C3 and P1 wells was insufficient to maintain fluid isolation between the two productive benches, given the current completion design and zipper fracing order. It is imperative to adjust the zipper sequence to adjust the leading or lagging well to minimize the FDIs.
- Job size: 10,000 bbl/stage proved to be too much for this pad configuration. Reducing the job size to 8,000 bbl/stage will result in significant reduction in FDIs while still providing adequate stimulation to maximize production from each well. The business outcome for the inventory of 45 drilled-yet-uncompleted (DUC) infill wells with this overly tight well spacing was to implement a baseline stimulation design modification that reduced the stage fluid volume by 20% or approximately 2,000 bbl.
- Zipper sequencing: The initial sequencing with the C3 leading multi-well operations yielded harmful FDIs and direct fluid communication with the depleted P1 well. Leading with C1, followed by C2 and then C3, yielded a significant reduction in harmful direct fluid FDIs on the P1 well. The augmented multi-well operations sequencing on the next most-proximal package of similarly spaced wells with the reduced fluid volume design resulted in significant curtailment of production interference on the primary well and precluded the requirement to invest in clean-out operations.
The ORCHID completions interpretation platform enabled the operator to monetize three infill wells’ completions data into actionable business outcomes that ultimately yielded a significant reduction in stage completions costs and informed future well spacing and multi-bench development strategies. All of the data enabled the operator to unlock and generate additional free cash flows and book additional reserves across the inventory of uncompleted wells within the asset.
REFERENCES
- Haimson, B., and C. Fairhurst, C., “Initiation and extension of hydraulic fractures in rocks,” SPE Journal 7 (03): 310–318, 1967. https://doi.org/10.2118/1710-PA.
- Ma, X., and M. Zoback, “Lithology-controlled stress variations and pad-scale faults: A case study of hydraulic fracturing in the Woodford shale, Oklahoma,” GEOPHYSICS 82: ID35-ID44, 2017. https://doi.org/10.1190/geo2017-0044.1.
- Savitzky, A., and M. J. E. Golay, “Smoothing and differentiation of data by simplified least squares procedures,”Analytical Chemistry 36 (8): 1627–39. Bibcode: 1964 AnaCh..36.1627S. doi:10.1021/ac60214a047, 1964.


- Executive viewpoint: Methane monitoring goes digital (May)
- Simplified intelligent completion architectures improve zonal control economics (May)
- From post-mortem to real-time: A scalable approach to fracture diagnostics (May)
- Why oil and gas companies should invest in ruggedized edge computing (May)
- Shaletech Report: Permian activity remains steady with growth through efficiencies (April)
- The value of all-electric intelligent completions (April)
- Subsea technology- Corrosion monitoring: From failure to success (February 2024)
- Applying ultra-deep LWD resistivity technology successfully in a SAGD operation (May 2019)
- Adoption of wireless intelligent completions advances (May 2019)
- Majors double down as takeaway crunch eases (April 2019)
- What’s new in well logging and formation evaluation (April 2019)
- Qualification of a 20,000-psi subsea BOP: A collaborative approach (February 2019)

