VIDYA RAJA and GEORGE G. CHASE, the University of Akron; BRADLEY N. JONES and THOMAS GEEHAN, M-I Swaco
Shale shakers are widely used for treatment of drilling fluid, or mud, during drilling operations. The mud is pumped into the borehole to carry larger particles away from the bore and out the top of the borehole. The mud exiting the wellbore carries with it larger sand and shale particles that must be removed before the fluid is circulated back to the borehole. The shakers use vibrating screens to separate these larger particles from the drilling fluid. The screens are constructed of stacked wire meshes, with the wire mesh that has the smallest openings on the top facing the mud. Particles collect on the screen as a filter cake. Vibration enhances the fluid flowrate through the screen and causes the cake to migrate along the screen surface to the exit.
Few mathematical models of screen performance are reported in literature. Most published models only consider the motions of dry particles moving over screens in linear or circulatory motion. One of the earliest published models of shale shakers is an experimental and theoretical study of vibratory screening of bentonite clay and water drilling fluids with a medium-fine suspension of sand particles.1 Limits in flow capacity of shale shakers were determined based on rheological properties of the drilling fluid, the screen mesh, the deck angle, the vibration frequency and the vibration acceleration. Correlations for flow capacity vs. screen length for various combinations of the operating parameters provide useful guidelines for screen cloth selection and screen operation.2 Later researchers studied solids-conveyance dynamics and shaker performance and developed a solids-conveyance model to obtain flow capacity of the shaker.3
The mathematical model in this article accounts for the fluid properties of the drilling mud. The model assumes constant values for parameters such as cake porosity and cake velocity across the screen. In future work, these parameters may be replaced by subscale models that account for the elliptical motion of the screen. The model also assumes that gravitational force is the mechanism that drives the liquid through the screen. Future models should account for the upward acceleration of the screen to enhance the liquid flow through the screen.
MODEL DESCRIPTION AND ASSUMPTIONS
Figure 1 shows a shaker diagram with some of the key features. The drilling mud, with particles to be removed, enters the screen area on the left-hand side. The mud moves downward by gravity through the screen, and particles larger than the screen pore openings form a cake on the screen surface. The cake layer moves to the right due to the vibrations of the screen. As the cake moves, more mud collects on the cake surface, causing the cake depth to increase as it moves to the right. Eventually, the surface of the cake reaches the mud-air surface; this location defines the end of the cake filtration section and the start of the drainage section.
Different phenomena occur in cake and drainage sections, requiring different mechanistic models. Hence, the screen model is divided into two sections. The first (left) is the cake-formation section, and a cake-filtration model is used to describe the performance. The second (right) is the liquid-drainage section, in which the liquid drains from the cake and is controlled by capillary forces as the fluid is pulled downward by gravity. This article discusses the derivation of the cake-filtration model and how that model is used to estimate the length of the screen needed for the cake-filtration section.
 |
|
Fig. 1. Diagram of the vibrating screen process.
|
|
CAKE FORMATION
Several assumptions are made to simplify the analysis of this complex and dynamic process:
• The drilling mud (excluding the particles that are separated) has constant and uniform density and viscosity. The concentration of fine colloidal particles that make up the mud is constant and uniform.
• The solid particles to be separated from the drilling mud are of constant and uniform diameter. Agglomeration of particles is neglected in this version of the model, and the particles have a constant intrinsic density.
• The process is isothermal.
• There are no chemical reactions or phase changes.
• The cake is incompressible (in this version of the model).
• The cake moves to the right in a constant velocity plug flow; the velocity is not a function of vertical position.
• The solid particles are uniformly distributed in the mud fluid with a constant concentration.
• The inertial and wall shear forces are negligible in the cake in the vertical direction.
• The overall process operates in a steady-state motion in that the screen vibrations are rapid enough that unsteady oscillations in the screen motions are negligible in the unsteady-state terms in the continuum model.
 |
|
Fig. 2. Cake section with the screen at angle B relative to the horizon. The free surface of the mud is height hm above the screen and the height of the top surface of the cake is hc, both a function of position x. Mud height at x=0 is ho. The screen length where hm=hc is x=L.
|
|
 |
|
Fig. 3. An arbitrary slice of the cake section of thickness Δx.
|
|
The primary equations used to model cake filtration are the mass and momentum balances for the solid (particles forming the cake) and the fluid (drilling mud) phases. Rectangular coordinates are used to set up the model with the x-axis parallel to the screen surface and the y-axis normal to the screen surface, Fig. 2. The general mass and momentum balances from volume-averaging theory for flows through a porous media are used as the starting equations.4,5 Applying the assumptions listed above, the mass and momentum balances for the solid (s) and liquid (L) phases can be simplified. The most useful equations are:
mass balance:  where where  Eq. 1 Eq. 1
such that 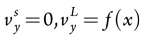 and and  Eqs. 2–4 Eqs. 2–4
and momentum balance, y-component, liquid phase:
 Eq. 5 Eq. 5
where v is velosity; EL is the liquid volume fraction in the cake; P is the liquid pressure at the cake surface; FLy is the drag force of liquid moving through the cake; and g is the vertical acceleration due to gravity. Thus, in the momentum balance equation, the first term on the right side represents the force due to the pressure gradient, the second term is the drag force between the liquid and solid phases in the cake, and the third term represents the gravitational force acting on the liquid phase.
To model the cake growth, consider a thin slice of the cake of thickness Δx as shown in Fig. 3. The air pressure is atmospheric at the free surface of the mud (Patm) and at the underside of the screen. The pressure at the mud-cake interface is Pc and the pressure at the cake-screen interface is Po.
From cake filtration literature, the rate of cake volume growth to the filtrate volume flowrate (through this section of cake) is given:6
and momentum balance, y-component, liquid phase:
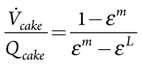 Eq. 6 Eq. 6
where Vcake is the time rate of change of the cake volume, Qcake is the filtrate rate from the cake, and Em and EL are the liquid phase volume fractions in the mud and cake, respectively.
The cake volume growth rate is related to the rate of change of cake height by:
 Eq. 7 Eq. 7
and the filtrate rate is related to the liquid velocity in the y-direction in the cake by:
 Eq. 8 Eq. 8
where b is the width of the screen in the z-direction.
At steady-state operation of the screen, the rate of cake height increase is only a function of position. The time rate of change of the cake height is converted to rate of change of position by applying chain rule in calculus to obtain:
 Eq. 9 Eq. 9
To obtain an expression for the liquid velocity in the y-direction in Eq. 9, we turn to the momentum balance. The pressure at the top of the cake can be obtained from the static head in the mud. Using the dimensions indicated in Fig. 3, the pressure at y = hc is:
 Eq. 10 Eq. 10
where the bulk density pm of the mud is the sum of the volume fractions pL and ps of the phases multiplied by the phase intrinsic densities, given by
 q. 11 q. 11
The height hm from the surface of the screen to the surface of the mud, is determined from the geometry in Fig. 2, assuming the surface of the mud is horizontal. Thus:
 Eq. 12 Eq. 12
Darcy’s law may be used to represent the drag force FLy in Eq. 5. Assuming constant properties, Eq. 5 may be integrated over the cake to obtain
 Eq. 13 Eq. 13
where u is the liquid viscosity and kc is the permeability of the cake. The permeability may be determined from experiments or estimated using a correlation such as Ergun’s equation.7,8 Using the latter, assuming spherical particles, the permeability is calculated by:
 Eq. 14 Eq. 14
A similar balance can be written for the pressure drop across the screen. The mass continuity requires the product of the velocity times the void volume for the cake and the screen to be the same. Combining the pressure relations yields the expression:

Eq. 15
where kSCR and hSCR are the permeability and thickness of the screen. Combining Eqs. 15 and 10, the velocity of liquid in the cake results in:
 Eq. 16 Eq. 16
Equation 16 is combined with Eq. 9 to calculate the cake height as a function of position. The position in x where the cake height equals the mud height given by Eq. 12 determines the length of screen used in the cake section of the vibrating screen. The total volumetric flowrate of the drilling mud passing through the screen in the cake section is obtained by integrating the y-direction velocity over position x in the cake section from 0 to L:
 Eq. 17 Eq. 17
MODEL SIMULATION RESULTS
A parametric study was performed to evaluate the effects of various process parameters on screen operation and to determine which parameters have a significant effect on screen performance. Parameter values used in the calculations are listed in Table 1.
Properties and operating parameters for an API 140 screen from M-I Swaco were used to set up the model. The properties of a water-based drilling fluid were used as inputs.
The flowrate increases at higher liquid volume fractions (porosity) and larger particle diameters, which is consistent with the dependence of permeability on these parameters, Fig. 4. The tilt angle of the screen was maintained constant at 3° for these calculations. Particle size and porosity have very little effect on screen length of the cake section in the present model.
 through the screen in the cake section. The tilt angle is 3°.") |
|
Fig. 4. Effect of particle size and porosity on volumetric flowrate (m3/s per meter width of screen) through the screen in the cake section. The tilt angle is 3°.
|
|
 |
|
Fig. 5. Effect of tilt angle on volumetric flowrate of mud through the screen in the cake section for different particle sizes. The porosity is 50%.
|
|
|
Table 1. Parameter values used for the calculations
|
 |
The variation of flowrate with typical screen tilt angles from 3° to 8° and for particle diameters ranging from 60 to 600 microns (0.00006 to 0.0006 m) is shown in Fig. 5. The tilt angle has little effect on flowrate for smaller particles, but as the particle size increases, the tilt angle does have a noticeable effect. The depth of the mud at the entrance to the screen was kept constant at 5.08 cm for these calculations. For larger particles, the flowrate was greater at small screen angles. Figure 6 shows the variation of screen length with tilt angles for various particle sizes. The mud depth and porosity were held constant at 5.08 cm and 50%, respectively, for these calculations. The plots lie on top of each other, possibly because the velocity of the cake moving in the x-direction was held constant at 0.107 m/s. A subscale model to account for the cake velocity is needed, and could change the trend shown.
As expected, the screen length increases with pool depth (ho) at all tilt angles of the screen, Fig. 7. Also, for a particular pool depth, the screen length decreases as the tilt angle increases. Both pool depth and flowrate increase with tilt angle for 1-m length of screen, Fig. 8. Here the length of screen of the cake section is held constant at 1 m. As the screen is tilted upward, the mud depth must increase for the mud height to stay above the cake for a distance of 1 m. Furthermore, the increase in mud depth results in an increase in flowrate.
Two different approaches were used to verify the accuracy of the calculations, a low-Reynolds-number analytical approximation and a Runga-Kutta numerical method using the commercially available Polymath software. The two methods showed good agreement, confirming the accuracy of the calculations. The trends in the parametric study are consistent with observations of the performance of typical shale shakers.
 |
|
Fig. 6. Effect of tilt angle on length of screen used for cake section. The pool depth is held constant at 5.08 cm and porosity of the cake is constant at 0.5.
|
|
 on screen length for the cake section at different tilt angles.") |
|
Fig. 7. Effect of pool depth (ho) on screen length for the cake section at different tilt angles.
|
|
 |
|
Fig. 8. Effect of tilt angle on pool depth and flow rate through the screen for a screen length of 1 m.
|
|
FUTURE WORK
In future work, the fluid properties should be changed from Newtonian to a yield-stress (i.e., Bingham plastic) fluid to better account for the mud properties. Subscale models are needed to predict the velocity of the cake in the x-direction and to predict the cake porosity in order to improve the model predictions and account for fluid-solid interactions. A model for the drainage section needs to be developed to predict the drainage rate and the moisture content of the final cake. Experimental data are needed to validate the model. The model may also be extended to oil-based muds by taking into consideration the effects of surface tension and colloidal particle attachment to the screen. 
ACKNOWLEDGMENT
This article was prepared from AADE-10-DF-HO-11 presented at the ADHE Fluids Conference and Exhibition held in Houston, April 6–7, 2010.
LITERATURE CITED
1 Hoberock, L. L., “A study of vibratory screening of drilling fluids,” Journal of Petroleum Technology, November 1980, pp. 1889–1902.
2 Hoberock, L. L. “Flow limits in vibrating screen separation of drilling fluids,” Filtration and Separation, March/April 1982, pp. 109–114.
3 Lal, M. and L. L. Hoberock, “Solids conveyance dynamics and shaker performance,” SPE Drilling Engineering , December 1988, pp. 385–394.
4 Slattery, J. C., Momentum, Energy, and Mass Transfer in Continua, Robert E. Krieger Publishing Company, New York, 1981.
5 Chase, G. G. “Transport phenomena in porous media,” Ch. 21 in Saleh, J., ed., Fluid Flow Handbook, McGraw-Hill, New York, 2002.
6 Chase, G. G. and M. S. Willis, “Compressive cake filtration,” Chemical Engineering Science, 47, No. 6, 1992, pp. 1373–1381.
7 McCabe, W. L., Smith, J. C. and P. Harriott, Unit Operations of Chemical Engineering, 7th Ed., McGraw-Hill, Boston, 2005.
8 MacDonald I. F., El-Sayed, M. S., Mow, K. and F. A. L. Dullien, “Flow through porous media: The Ergun equation revisited,” Industrial Engineering Chemistry Fundamentals, 18, No. 3, 1979, pp. 199–208.
|

