Integrating real-time drilling analytics to reduce carbon intensity and operational risk
WILLIAM J. BERGER III, ZACHARY I. METZ, SHAMS UL-HADI, and NORMAN E. WELLS JR, B‑GEO, Houston, Texas
Drilling performance is increasingly evaluated through a dual lens: operational efficiency and carbon intensity. Operators remain accountable for safety, cost and delivery, yet stakeholders now expect credible evidence that wells are installed with the lowest feasible emissions (low-carbon) footprint.
In practice, carbon emissions from drilling are largely a function of time and disruption—and the same actions that prevent escalation events often deliver the largest carbon reductions. A practical real-time analytics framework can shorten time-to-awareness, reduce non-productive time (NPT), and quantify the carbon value of avoided disruption—particularly in shallow hazard environments where response windows are limited.
“In drilling, carbon emission is largely a function of time and disruption—avoid the disruption and you avoid the emissions. Early detection is key.”
WHY IT MATTERS: CARBON IS TIME, AND TIME IS RISK
Well construction emissions are dominated by fuel burned to generate rig power and run high‑load systems. Lifecycle and carbon‑intensity analyses for upstream production consistently show that operational time under load is a primary driver of Scope 1 emissions intensity, especially when events force extended circulation, additional cementing or sidetracks.[1][2][3] For many rigs, the simplest and most defensible emissions narrative is also the most operationally meaningful: reduce unplanned rig hours.
Credible quantification starts with transparent factors. The EPA inventory factors for distillate fuel indicate ~10.21 kg CO₂ per gallon of diesel combusted,[20] consistent with IPCC guidance when expressed per unit mass of fuel.[21] From there, emissions scale linearly with fuel rate and time. If an offshore deepwater rig burns 6,000–12,000 gal/day under steady load—a range consistent with industry benchmarking and operator/contractor sustainability materials[17][18][19]—then one day of unplanned time can add on the order of 60–120 metric tons of CO₂. That is before considering support vessels, standby services and materials logistics. The operational implication is clear: the fastest path to lower emissions is often preventing the events that elongate the tail of drilling time.
FROM DESCRIPTIVE METRICS TO PREDICTIVE CONTROL
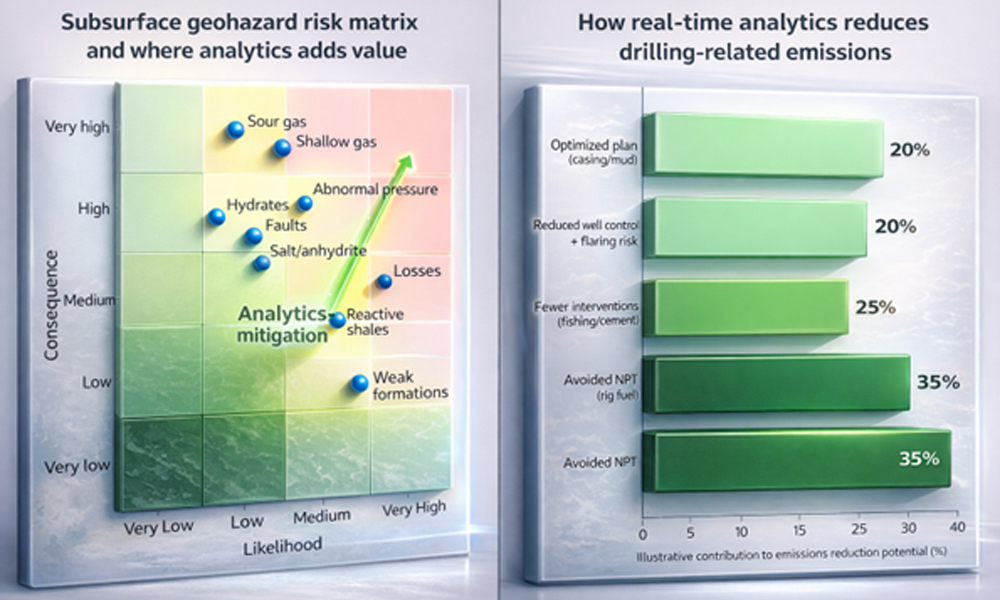
The industry has become highly effective at measuring what happened—rate of penetration, connection time, cost per foot, days versus depth. Yet these metrics can obscure the drivers of failure. A well may post strong ROP and still incur significant NPT from losses, instability, pressure transitions, or degraded hole quality (borehole instability). Many of these events are often connected to subsurface geohazards, Fig. 1. Predictive analytics shift performance from retrospective reporting to forward-looking control by converting high-frequency drilling signals into early warnings that arrive soon enough to alter operational decisions.
A practical predictive stack typically combines:
- Real-time transmission (streaming) of surface and downhole data;
- Automated QA/QC and contextualization;
- Physics‑based models (hydraulics/ECD, cuttings transport, wellbore stability, PP/FG);
- Statistical or machine‑learning pattern recognition that detects multivariate drift.
This hybrid approach is increasingly reflected in real‑time digital drilling publications and industry technology programs.[4][5]
WHERE THE BIGGEST VALUE SITS: SUBSURFACE-DRIVEN HAZARDS
Many high-cost disruptions are subsurface‑driven and probabilistic, Fig. 1. For instance, losses often begin as small flow imbalance and pressure response changes; instability begins as incremental cuttings loading, rising drag, torque oscillations and ECD creep. In these regimes, teams do not necessarily need more data—they need faster, clearer interpretation that integrates weak signals across channels.
In the case of lost circulation, technical literature shows that losses frequently evolve from minor seepage to partial losses to severe losses, with intensity and formation condition governing the speed of escalation. Risk prediction approaches, intensity characterization and NPT impact analyses provide a well‑documented basis for early intervention thresholds and response playbooks.[6][7][8][9][10] From an emissions standpoint, the carbon cost is not only the lost fluid; it is the additional hours of circulation, conditioning and remediation required once the event escalates (also reminded of the carbon cost to produce drilling fluid).
QUANTIFYING CARBON BENEFITS WITHOUT PERFECT METERING
Direct emissions measurement at the rig is improving, but many programs still rely on proxies. A strong approach for trade‑publication reporting is to quantify avoided rig days, avoided high‑load interventions and avoided material-intensive remediation. Emissions are then estimated, using published fuel factors (EPA/IPCC) and program‑specific fuel rates.[20][21]
Peer‑reviewed and technical planning methods for offshore energy use and early-phase assessment emphasize the value of scenario-based estimation—bounding fuel, time and intervention frequency to produce decision‑ready ranges.[11][12][13][14] This approach also improves internal prioritization: it tells teams which event types dominate both cost and carbon.
OFFSHORE EXAMPLE – QUANTIFYING ESCALATION OF HAZARDS: SHALLOW WATER FLOW SURVEILLANCE WITH THE DISCHARGE CATEGORY MODEL
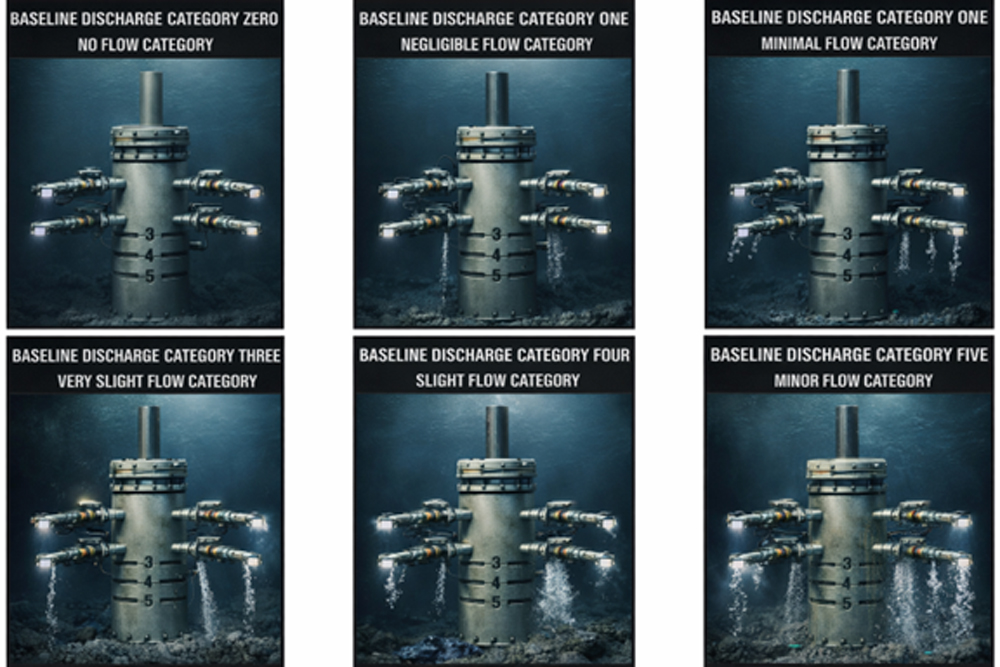
Shallow hazards can be unforgiving, because the response window is short. Shallow Water Flow (SWF) can destabilize unconsolidated sediments, drive pack-offs, and force time‑ and material‑intensive mitigation. In many operations, the emissions penalty is driven less by the initial symptom and more by the remediation cycle that follows: extended circulation at high pump rates, heavier mud treatments, cement squeezes and, in worst cases, replacement well and/or sidetrack operations.
The Discharge Category Model (DCM), as seen in Fig. 2, was developed to reduce time‑to‑awareness in the shallow section by classifying discharge behavior in real time. The model establishes a baseline discharge signature for the well and detects subtle deviations that act as precursor indicators before visible escalation. In field deployments, early recognition has enabled interventions that avoided 8 to 36 hrs of potential NPT per precursor event,[22] with the category logic and methodology documented in the associated patented materials.[43]
To quantify the carbon value of early SWF detection, operators can apply the same proxy approach described earlier. For example, if an SWF escalation response typically consumes 12 to 48 hrs of additional rig time and elevated circulation, then preventing a single 24‑hr escalation can avoid roughly one day of fuel burn, plus the additional energy associated with remediation. Even under conservative assumptions, that is often tens to over 100 metric tons of CO₂ avoided per event, when direct fuel and intervention overheads are included.[20][21] Across a multi‑well campaign, preventing only a handful of escalations can dominate the carbon outcome of the program.
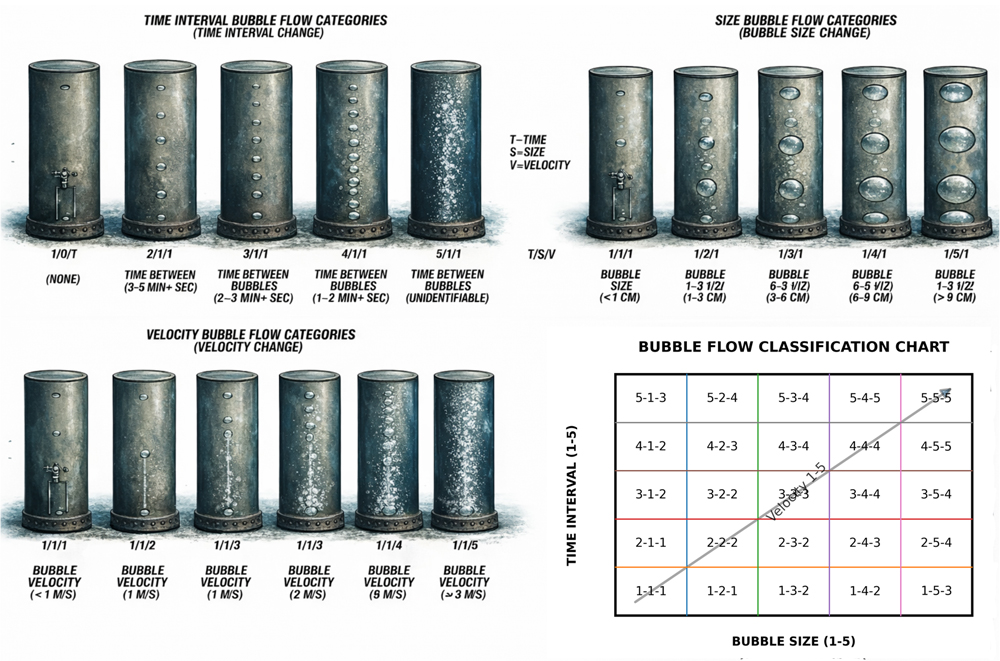
OFFSHORE EXAMPLE: SHALLOW GAS—CLASSIFICATION THAT SUPPORTS EARLY SITUATIONAL AWARENESS
Shallow gas shares a similar operational reality: the difference between a manageable situation and a disruptive event is often detection timing and interpretation confidence. Classification schemes that integrate bubble size, interval timing and apparent velocity (Fig. 3) help teams distinguish background behavior from escalation patterns, particularly when corroborated with pressure response and flow trends.[24] These methods align with broader shallow hazard documentation and offshore reporting frameworks.[16][15]
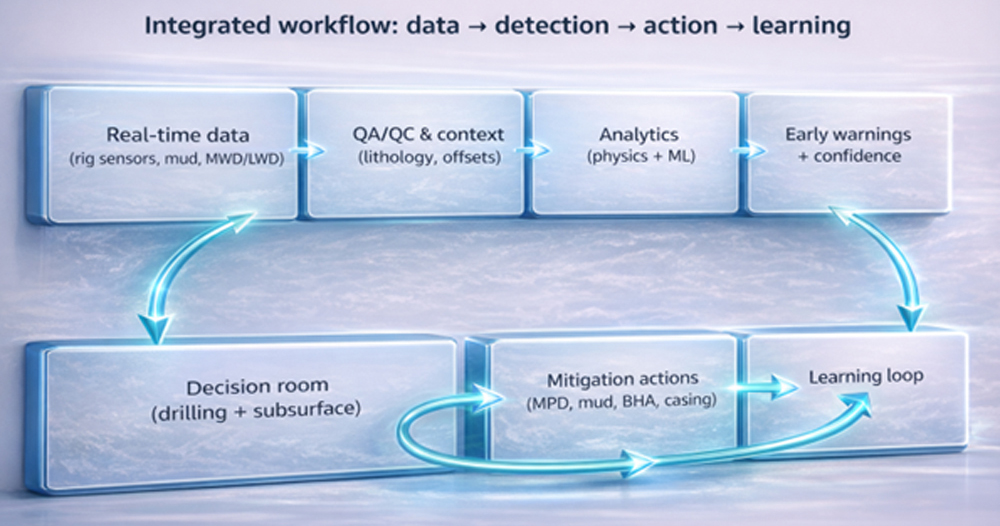
MAKING RESULTS REPEATABLE: PEOPLE, PROCESS AND PLATFORM
Analytics programs often stumble for predictable reasons: data fidelity degradation, alert fatigue and unclear decision rights. High‑performing implementations treat analytics as an operating model. Data quality is validated automatically; models are contextualized to the geology; alerts are few, explainable and linked to response playbooks; and outcomes are captured, so thresholds improve with each well, Fig. 4. Digital drilling programs emphasize precisely this linkage between data foundation, decision rooms and closed‑loop learning.[4][5]
ONSHORE EXAMPLE: PREDICTIVE INJECTION CONTROL FOR INDUCED SEISMIC RISK
Induced seismicity associated with high-volume saltwater disposal has become one of the most closely regulated operational risks in several U.S. basins. U.S. Geological Survey (USGS) hazard assessments have documented correlations between sustained injection volume, pore-pressure diffusion and increased seismic probability in susceptible geologic settings.[25] In response, both the Oklahoma Corporation Commission (OCC) and the Texas Railroad Commission (RRC) have implemented seismic response protocols requiring rate reductions, pressure constraints or well shut-ins when defined seismic thresholds are exceeded.[26][27]
While seismicity is primarily treated as a public safety and regulatory matter, it also carries measurable carbon implications. Regulatory-driven curtailments often trigger abrupt injection reductions, emergency redistribution of produced water, increased trucking and elevated pump energy at alternate disposal wells. These responses increase fuel consumption and emissions intensity per barrel handled.
A predictive framework developed under the pending patent, “Systems and Methods for Predicting and Controlling Induced Seismic Events by Adjusting Well Operations” (Berger et al.), applies real-time injection data and subsurface parameters to identify operating conditions associated with elevated seismic probability before regulatory triggers are reached.
FROM THRESHOLD RESPONSE TO PREDICTIVE MANAGEMENT
Conventional seismic management is largely threshold-based. Operators monitor regional event magnitude and proximity, adjusting injection, once prescribed limits are exceeded. By that stage, pressure diffusion and stress redistribution along critically oriented faults may already be progressing.
The predictive model shifts intervention upstream by integrating:
- Injection rate and acceleration trends
- Cumulative injected volume
- Bottomhole pressure response
- Formation transmissivity and diffusivity
- Fault proximity and orientation
- Regional stress regime
- Historical seismic response lag behavior.
These inputs are evaluated within a probabilistic risk envelope that identifies when injection trajectories approach fault activation conditions described in USGS and basin-specific studies.[25]
As with shallow water flow and shallow gas monitoring offshore, the objective is not reaction—it is escalation prevention (early detection).
QUANTIFIED CARBON IMPLICATIONS OF SEISMIC CURTAILMENT
The carbon linkage emerges through disruption avoidance.
Consider a high-volume disposal well injecting approximately 30,000 bpd. If regulatory intervention mandates a 40% rate reduction for ten days, approximately 120,000 bbl must be re-routed or temporarily stored.
Under conservative assumptions:
- Truck transport of produced water averages roughly 0.15 to 0.25 metric tons of CO₂ per 1,000 bbl, depending on haul distance and fleet efficiency.
- Redistribution of 120,000 bbl could add approximately 18 to 30 metric tons of CO₂ from transport alone.
- Additional pump energy at alternate injection sites may add several metric tons more, depending on pressure differentials and runtime.
These emissions occur before accounting for production throttling, infrastructure strain, or extended regulatory oversight cycles.
By contrast, proactive rate tapering of 10% to 15%, implemented weeks earlier, can maintain network balance without triggering regulatory thresholds. The incremental energy impact of modest rate reduction is materially smaller than the emissions associated with abrupt redistribution and operational disruption.
As with the SWF and shallow gas cases offshore, the carbon benefit is not derived from drilling faster—it is derived from preventing escalation.
FIELD DEPLOYMENT SUMMARY
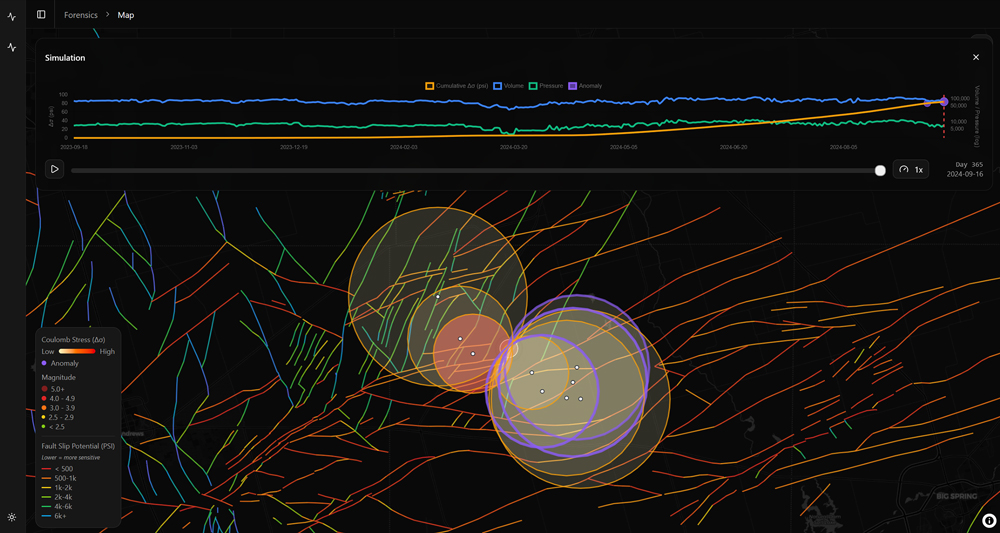
In a multi-well onshore injection network, operating within a seismically sensitive corridor, the predictive model monitored real-time injection rates, cumulative formation loading, and basin-specific diffusivity parameters, Figs. 5 and 6. During a sustained high-volume injection phase, the model identified a projected stress exceedance envelope approximately 18 days before seismic clustering historically occurred under similar conditions.
Injection rates were proactively reduced by approximately 12% across three disposal wells:
- No regulatory curtailment was triggered.
- No felt seismic events were recorded during the projected window.
- No emergency redistribution was required.
Had rates remained unchanged and state-directed reductions been imposed, multi-well curtailment and fluid redistribution would likely have occurred under prevailing regulatory frameworks.[26][27]
The avoided redistribution cycle represented a conservative emissions avoidance of approximately 20 to 40 metric tons of CO₂ equivalent over the intervention period, excluding secondary energy effects.
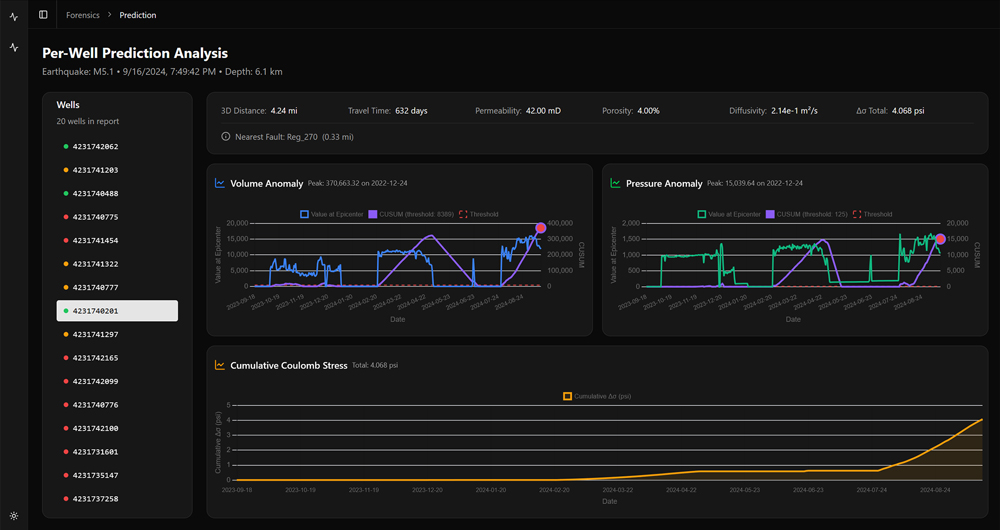
EXTENDING THE PREDICTIVE MODEL ACROSS THE ASSET LIFECYCLE
This case demonstrates that predictive analytics extends beyond drilling optimization, Fig. 6. The same principles applied to shallow water flow and shallow gas surveillance offshore—early anomaly detection, deviation fingerprinting, and structured intervention—translate directly to injection management onshore.
USGS hazard modeling confirms that injection rate and cumulative loading remain primary operational levers in induced seismic mitigation.[25] Embedding predictive control upstream of regulatory thresholds converts abrupt, high-carbon disruption into controlled operational adjustment.
The broader implication mirrors the offshore SWF and shallow gas cases: the most scalable emissions reduction mechanism in subsurface operations is disruption avoidance.
Whether preventing shallow flow escalation or mitigating fault reactivation, earlier intervention reduces operational risk and lowers lifecycle carbon intensity simultaneously.
CONCLUSION: PORTFOLIO-SCALE CARBON AND RISK REDUCTION THROUGH PREDICTIVE CONTROL
The strategic implication is no longer theoretical. Across both offshore drilling and onshore injection operations, carbon reduction and risk mitigation are delivered through the same operational lever—disruption avoidance.
The shallow water flow case illustrates how early discharge classification prevents escalation into mud losses, remedial cementing, and extended rig time. The injection control case demonstrates that proactive rate tapering reduces the probability of regulatory curtailment, fluid redistribution, and elevated logistics emissions. In both contexts, predictive analytics shift intervention upstream of failure thresholds.
A hybrid real-time framework—combining physics-based subsurface modeling with high-frequency anomaly detection—reduces decision latency, limits escalation into high-energy remediation and improves repeatability across wells and disposal networks. When coupled with transparent proxy-based quantification of avoided rig days, avoided redistribution cycles and avoided intervention loads, these systems allow operators to credibly translate avoided NPT into avoided emissions.
At portfolio scale, the impact compounds. Preventing a handful of multi-day offshore remediation events or regional injection curtailments can offset more emissions than marginal efficiency gains alone. The most scalable carbon lever in subsurface operations is not incremental drilling speed—it is fewer surprises.
The next frontier in well construction and injection management is not simply drilling faster or injecting more efficiently. It is drilling and operating with foresight: fewer escalation events, fewer emergency responses, fewer regulatory interventions and correspondingly fewer tons of CO₂ emitted per well and per barrel handled.
Predictive control does not replace engineering judgment—it enhances it. When embedded within disciplined workflows and data governance, it becomes a repeatable operating model capable of delivering measurable carbon and risk reduction across the lifecycle of subsurface assets.
ABOUT THE AUTHORS
WILLIAM J. BERGER III earned a BS degree in marine sciences from Texas A&M University at Galveston in 1994 and completed the Owner/President Management Program at Harvard Business School in 2017. He founded Berger Geosciences, LLC (B-geO) in 2007 and serves as CEO. Mr. Berger has more than 30 years of experience supporting offshore site investigations in deepwater basins worldwide, including projects involving geology, oceanography, biology and marine archaeology. He is the primary author of several U.S. patents related to subsurface hazard monitoring and energy industry technologies.
SHAMS UL-HADI earned an MS degree in geology from the University of Peshawar, Pakistan, and a Ph.D. in geology from the University of Houston. Since joining Berger Geosciences, LLC (B-geO) in 2012, he has worked as a geoscientist specializing in pore pressure and fracture gradient prediction in the Gulf of Mexico. Previously, Mr. Ul-Hadi served as an exploration geologist with Oil & Gas Development Company Limited (OGDCL) in Pakistan from 2001 to 2008 and began his career as a geology lecturer at the University of Peshawar. His research interests include tectonics and basin-scale structural evolution.
ZACHARY I. METZ earned a BS degree in geology from the University of Houston and has more than 20 years of experience in the energy industry. He joined Berger Geosciences, LLC (B-geO) in 2010 and currently serves as chief operating officer, overseeing project execution, business development and technical operations. Mr. Metz has expertise in shallow geohazard assessment, overpressure prediction and subsurface risk evaluation in the Gulf of Mexico and unconventional reservoirs. Earlier in his career, he worked with Geoscience Earth and Marine Services in cartography and client services roles.
NORMAN E. WELLS, JR., earned a BA degree in geology from Miami University (Ohio) and an MS degree in geology from the University of Texas-Permian Basin. He has more than 20 years of experience across the petroleum and environmental sectors and joined Berger Geosciences, LLC (B-geO) in 2012. Mr. Wells’ experience includes wellsite geology, mud logging, shallow hazard monitoring and operations geology in the Permian basin, as well as real-time geopressure analysis and offshore drilling support for global operations.
REFERENCES
- University of Michigan. (2024). Climate Impact of U.S. Offshore Oil and Gas Production. University of Michigan.
- (2023). GHG Emission Intensity of Crude Oil and Condensate Production. National Ocean Industries Association (NOIA).
- Jabiyev, I. (2025). Understand the impact of your crude oil supply chain. Carbon Chain.
- Chan, A.W., Murray, D., de Gennaro, S., & O’Reilly, G. (2024), Upstream Can lost circulation materials cure losses across fault damage zones? 14 Shell TechXplorer Digest.
- Jandinez, G., Villamil, G., Peralta, J. Balcom, B., & Tiggelaar, J. White Paper: Progressive Decarbonization of Drilling Fluids Minimizing Chemical Use and Carbon Emissions. Offshore Technology Conference Asia.
- Zhang, J., Feng, Y., Ma, S., Hao, Z., He, B., Wei, J., & Deng, J. (2025). Prediction of lost circulation risk in fractured formations based on 3D geomechanical modeling. International Journal of Mining Science and Technology.
- Cole, P., Young, K., Doke, C., Duncan, N., & Eustes, B. (2017). A Baseline Study of Nonproductive Time Related to Lost Circulation. 42nd Workshop on Geothermal Reservoir Engineering, Stanford University, Stanford, CA.
- Azadivash, A. (2024). Lost circulation intensity characterization in drilling operations: Leveraging machine learning and well log data. Heliyon, 11(1).
- Lowry, T., Winn, C., Dobson, P., Samuel, A., Kneafsey, T, Bauer, S., & Ulrich, C. (2022). Examining the Monetary and Time Costs of Lost Circulation. 47th Workshop on Geothermal Reservoir Engineering, Stanford University, Stanford, CA.
- Cook, J., Growchock, F., Guo, Q., Hodder, M., & van Oort, E. (2012). Stabilizing the Wellbore to Prevent Lost Circulation. Oilfield Review, Winter 2011/2012: 23, No. 4.
- Eyni, L., Stanko, M., & Schumann, H. (2022). Methods for early-phase planning of offshore fields considering environmental performance. Energy, 256.
- Ozowe, W., Ikevuje, A.H., Ogbu, A.D., & Esiri, A.E. (2022). Energy efficiency measures for oil rig operations. Magna Scientia Advanced Research and Reviews, 05(01): 054-068.
- Yildiz, M.I., & Yilmaz, A. (2024). Fuel consumption analysis and cost overview of mechanical vehicles in petroleum drilling rig. European Mechanical Science, 8(4): 1-11.
- MacDonald, J. (2014). Providing Scope for Reducing the Carbon Footprint of an Offshore Oil Rig. University of Strathclyde, Department of Mechanical and Aerospace Engineering. Thesis.
- Ozowe, W., Ikevuje, A.H., Ogvu, A.D., & Esiri, A.E. (2022). Energy efficiency measures for oil rig operations. Magna Scienctia Advanced Research and Reviews, 05(01): 054-068.
- S. Environmental Protection Agency (EPA). (Unk.) Offshore Petroleum and Natural Gas Production. US EPA, Petroleum and Natural Gas Systems (40 CFR 98, Subpart W).
- American Bureau of Shipping (ABS). (2025). Beyond The Horizon 2025 Sustainability Outlook. ABS.
- (2025). Investor Presentation. Valaris.
- (2025). Growing upstream capital markets update. BP.
- S. Environmental Protection Agency (EPA). (2026). Emission Factors for Greenhouse Gas Inventories. EPA.
- 2006, IPCC Guidelines for National Greenhouse Gas Inventories, Volume 2: Energy (fuel carbon content and CO₂ conversion factors)
- B-geO internal field dataset (SWF/DCM monitoring results; anonymized well set; 2024–2025).
- S. Patent No. 8,905,155 B1, “Marine Well with Shallow-Water Flow Monitoring,” Berger et al., issued Dec. 9, 2014.
- S. Patent No. 9,261,391 B2, “System for Monitoring a Surface for Gas and Oil Flow,” Berger et al., issued Feb. 16, 2016.
- S. Geological Survey (USGS), “Induced Earthquakes,” Earthquake Hazards Program, Reston, VA, latest update 2023–2024.
- Oklahoma Corporation Commission (OCC) 2018, “Oil and Gas Conservation Division Seismicity Response Protocol,” Oklahoma City, OK, current regulatory framework.
- Texas Railroad Commission (RRC), “Seismicity Review Procedures and Injection Well Monitoring Requirements,” Austin, TX, current regulatory guidance.
- Precision in flare measurement paves the way for a sustainable future in the oil and gas industry (March)
- Drilling technology: Drill bit advances continue their relentless march forward (March)
- Drilling advances: Gas: What’s a mother to do? (March)
- Produced water: Asset or liability? (March)
- Produced water treatment market: The next big wave in industrial sustainability (March)
- Start-up breaks temperature barrier in directional drilling, a challenge pursued for years (March)
- Subsea technology- Corrosion monitoring: From failure to success (February 2024)
- Applying ultra-deep LWD resistivity technology successfully in a SAGD operation (May 2019)
- Adoption of wireless intelligent completions advances (May 2019)
- Majors double down as takeaway crunch eases (April 2019)
- What’s new in well logging and formation evaluation (April 2019)
- Qualification of a 20,000-psi subsea BOP: A collaborative approach (February 2019)

