Flare combustion monitoring system for upstream flares
Flares are open combustion devices for burning off waste and unwanted gas, crucial for emergency pressure relief across petroleum processes throughout the upstream and downstream sectors.
The purpose of burning the waste gas—mainly hydrocarbons and hazardous gases—is to convert them into CO2, a lesser toxic and environmentally impactful gas, compared to hydrocarbons. For example, the greenhouse effect of methane (CH4) is 84 times more than that of CO2 over a 20-year period.
Combustion efficiency (CE), which measures the percentage of hydrocarbons that are completely combusted and converted into CO2 and H2O, is one of the key parameters in the ability to minimize emissions.
IMPORTANCE OF ENSURING COMPLETE COMBUSTION
Why is it important to ensure complete combustion and conversion of the hydrocarbons?
There are many reasons. From a climate change perspective, operators want to limit the volume of emissions, particularly harmful emissions, such as methane, escaping into the atmosphere and causing long-term damage. With ever more ambitious decarbonization strategies, there is growing momentum amongst operators to lead the energy transition and significantly reduce their carbon footprints.
From an operational perspective, optimizing combustion efficiency makes good business sense. It generally requires less steam, less energy and, therefore, less cost.
There are also more stringent regulations on flaring to ensure high efficiency and minimize soot/smoke emissions for the downstream sector, because most facilities are in onshore residential areas. The estimated flare efficiency is 93.9% for downstream flares, in contrast to the assumed flare destruction efficiency of 98%, according to U.S. Environmental Protection Agency (EPA) studies.1 For upstream flares, there is no current requirement in monitoring flaring efficiency, which may deviate from the desired flaring efficiency of 98%, due to variations of process and environmental conditions.
According to the World Bank Flare Tracker, global gas flaring (mainly natural gas) is around 150 Bcm yearly, with the upstream sector contributing 90%.2 When evaluating the environmental impact from upstream flaring, accurate flaring efficiency, rather than using the estimated value, is critical to prevent methane slip.
FLARE COMBUSTION EFFICIENCY
Flare CE has been the subject of both experimental and theoretical studies, due to its importance in understanding the combustion chemistry, as well as the ability of flare systems to effectively burn off flare waste gases. Computational fluid dynamics (CFD) with different combustion models, such as Eddy dispersion concept (EDC) and probability density function (PDF), have been carried out to understand flare combustion mechanisms and factors that influence flare combustion efficiency.
Castineira studied flare combustion efficiency and emissions, using the Laminar Flamelet model, a simplified turbulent CFD calculation. The results match well with turbulent wind tunnel experiments for turbulent flaring conditions.3
Singh etc. calculated the CE for both lab scale and industrial scale flares, using the EDC turbulence model. Compared to experimental data from the Texas Commission on Environment Quality (TCEQ) study, the average error in CE for calculated results is only 3.04%.4 Despite the computational cost, progress in CFD has made accurate CE calculation for flaring possible.
Monitoring and measuring industrial flare combustion efficiency has been a longstanding challenge. With the tightened regulations and requirements for flaring, major progress has been made in understanding flare combustion and operations in recent years.
One of the most extensive experimental studies was directed by TCEQ in 2010, known as the TCEQ 2010 flare study. Samples of the flare plume were extracted after flare combustion and analyzed using state-of-the-art analyzers to measure the CE and destruction efficiency. As a semi-controlled study, where flare operation conditions were contained with uncontrolled ambient environmental conditions, a wide range of operation conditions, test configurations and flare tip designs etc., were tested, and the results were made public, available through the Texas state website.5
This extractive sampling technique is considered the most accurate benchmark method, as it directly measures the flare plume gas. Due to its instrumentation and data analyzing complexity, the sample extraction method is only suited for research and not feasible to commercialize, to be employed and used for CE measurement in the field.
One of the more practical approaches to measuring flare CE is to use remote monitoring techniques, such as a multi-spectral infrared imaginer that measures unburned hydrocarbons and CO2 concentration in the combustion plume, in the mid-infrared spectrum region.6 Despite its high cost, this camera technique has shown great potential to measure and monitor industrial flare combustion. It demonstrated an average CE measurement error of 0.5% in the 28 test cases, comparing well to TCEQ sample extraction results.
Being an optical-based method, it requires routine maintenance, such as annual sensor calibration and window cleaning, and can be impacted by adverse weather conditions, such as heavy fog/rain and high wind. Smoke from flaring also can interfere with the camera measurement, causing excessive errors in CE measurement. For direct measurement, the camera method is a great alternative for periodic flare combustion spot checks.
PARAMETRIC MODELING
In this article, we present a unique method for flare combustion monitoring, based on a parametric model that considers all the factors affecting flare combustion efficiency. These factors include the flare vent gas net heating value in the combustion zone (NHVzc), effective flare tip diameter, vent gas exit velocity, crosswind at flare tip and gas composition, etc. From the CFD studies and existing test data of flare combustion, all the factors, either one single factor or a combination of several, have shown strong correlation to flare CE.
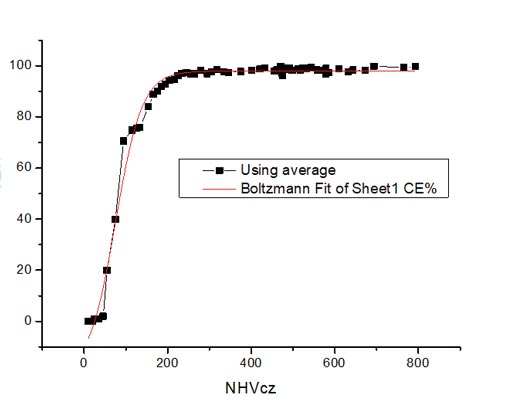
The effect can be described using numeric models. For example, NHVcz is one of the most important factors affecting flare CE, as shown in Fig. 1. The strong correlation between NHVcz and flare CE is the basis of maintaining NHVcz greater than 270 BTU/SCF for refinery flares in the U.S. EPA refinery sector rules (RSR), known as the Maximum Available Control Technology, MACT II, passed in 2015.
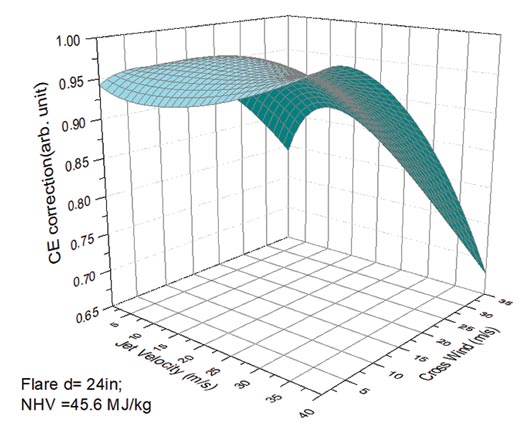
One of the major challenges in developing a parametric model of flare combustion is quantifying the interactions of the factors on flare CE. For example, crosswind can significantly impact flare combustion, especially for low flare flow conditions. However, the crosswind effect on flare CE also depends on flare gas NHV, flare gas exit velocity and flare tip diameter, as shown in Fig. 2.
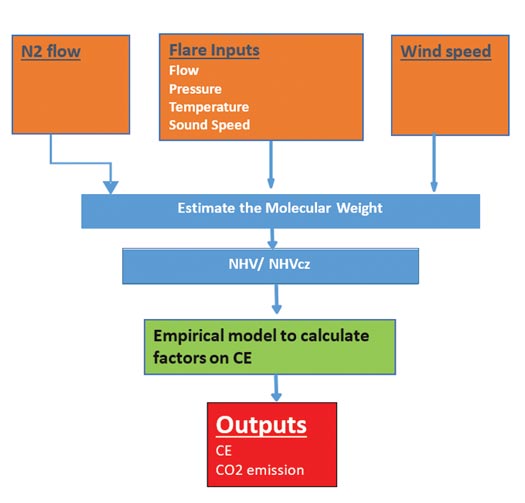
The parametric modeling method utilizing the flare process data, such as flare flow, N2 purge flow and the vent gas molecular weight, derived from ultrasonic flow meter sound speed measurement, generates the NHV of flare gas, as shown in Fig. 3. With readily available information on windspeed, gas composition, flare tip diameter, etc., an empirical parametric model calculating flare combustion efficiency based on existing test data and CFD calculations has been developed.
The overall model error of combustion efficiency in high heating value region (NHVcz > 300 BTU/SCF) is +/-1.05% (absolute value), compared to experimental data. Based on the combustion efficiency, emissions of unburned hydrocarbon, CO, CO2 and CO2 equivalent can be calculated, as shown in Fig. 3. This method is particularly suitable for upstream applications, as flare configuration is much simpler, usually without any assisted gases and with relatively stable gas composition. With limited instrument updates, such as a common weather station for windspeed measurement, this method can be deployed to any upstream flare system for reliable, accurate and continuous flare combustion monitoring.
This flare combustion monitoring system can be deployed via cloud-based internet or through flare data management systems. It has been tested in the field for upstream flares to achieve real-time, continuous flare combustion efficiency monitoring.
FIELD RESULTS
Figure 4 shows the field test results of an upstream flare combustion efficiency, using the parametric modeling method and the IR camera measurement for six days. Overall, the calculated CE is aligned with the camera-measured results, with the exception of the first two days, when both the windspeed and flare gas NHV were high. The calculated CE appeared to be high for those cases, comparing to the camera results, even though the camera performance may also have been negatively impacted by the high windspeed.
A key feature of this parametric method is that the parameters can be fine-tuned for a specific flare, using reliable test data or flare system-specific CDF calculations, so it will be more accurate for a broader range of flare configurations and applications. Periodic calibration with accurate CE measurement can be helpful to verify and improve model accuracy.

CONCLUSIONS

The energy transition is gathering pace, and the oil and gas sector is moving toward a carbon-neutral era through various programs, such as Global Gas Flaring Reduction Partnership (GGRP) and Zero routine flares by 2030 initiative, etc. However, flaring will continue to be a major source of greenhouse gas emissions in the short term.
Flare combustion monitoring is required to accurately measure the emissions, prevent methane slip and evaluate the environmental impact. Any carbon tax or trading system for flaring also requires meaningful and accurate emission measurement. This parametric model (Fig. 5) of combustion efficiency calculation is the most promising technique for flare combustion monitoring, because it’s reliable, accurate and easily scalable across the industry.
Combined with the ultrasonic flowmeter, where key flare gas information, such as vent gas flow, MW and NHV can be derived from the sound speed measurement, the method requires little or no update to hardware for any existing flare systems to achieve continuous flare combustion monitoring.
REFERENCES
- https://www.worldbank.org/en/news/press-release/2019/06/12/increased-shale-oil-production-and-political-conflict-contribute-to-increase-in-global-gas-flaring
- U.S. EPA 40 CFR parts 60 and 63, 2015.
- Castineira, David, and Thomas F. Edgar, “Computational fluid dynamics for simulation of wind-tunnel experiments on flare combustion systems,” Energy & Fuels, 22(2008), 1698-1706.
- Singh, etc. “Computational fluid dynamics modeling of laboratory flames and an industrial flare,” Journal of the Air &Waste Management Association, 64 (2014) 1328-1340.
- https://www.tceq.texas.gov/assets/public/implementation/air/rules/Flare/2010flarestudy/2010-flare-study-final-report.pdf
- Zeng, Yousheng, Jon Morris and Mark Dombrowski, “Validation of a new method for measuring and continuously monitoring the efficiency of industrial flares,” Journal of the
Air &Waste Management Association, 66 (2016) 76-86.
- Precision in flare measurement paves the way for a sustainable future in the oil and gas industry (March)
- Integrating real-time drilling analytics to reduce carbon intensity and operational risk (March)
- Regional Report: Brazil reaches for new heights in 2026 (March)
- Trade associations provide connection that will carry industry forward (March)
- Produced water: Asset or liability? (March)
- Produced water treatment market: The next big wave in industrial sustainability (March)
- Subsea technology- Corrosion monitoring: From failure to success (February 2024)
- Applying ultra-deep LWD resistivity technology successfully in a SAGD operation (May 2019)
- Adoption of wireless intelligent completions advances (May 2019)
- Majors double down as takeaway crunch eases (April 2019)
- What’s new in well logging and formation evaluation (April 2019)
- Qualification of a 20,000-psi subsea BOP: A collaborative approach (February 2019)

