Closing the loop: Real-time measurement of oil in water for process facilities
When an oilfield’s reservoir pressure is depleted during primary recovery, additional oil can be recovered by recycling the produced water and injecting it back into the reservoir. Water management is critical for such water and water-alternating-gas (WAG) floods. In its Permian basin operations, Occidental recovers, recycles, and re-injects large volumes of water for its enhanced oil recovery (EOR) operations. With real-time monitoring of oil in water (OiW) delivering reliable and continuous data, Occidental identified a way to optimize the recovery process and is working with NOV to expand the use of OiW monitoring equipment.
The oil content of recycled water for injection is important in terms of both revenue and operating costs. Oil injected into a well could have been sold, and it also increases the frequency of well workovers to maintain injection throughput. “Given the volume of produced water Occidental processes, the efficiency of our Permian EOR operations is largely determined by how well we process and recycle produced water,” according to author Brian Crum, facilities engineer for Occidental.
For the purposes of this study to reduce the OiW content at this facility, Occidental established a target OiW concentration of 100 ppm, as efforts to achieve lower concentrations are often met with diminishing returns. There are several ways to monitor OiW concentration.
OiW measurement methods. On the low-cost end of the spectrum is periodic manual sampling of fluids for field or lab analysis. The manual sample represents a brief snapshot in time. If oil content fluctuates over time, manual sampling could miss OiW concentration spikes and trends, and the operator would fail to make process changes. Periodic sampling may not provide enough information to determine how much oil is really entering the injection system.
Continuous OiW monitoring provides a more complete picture. There are several technologies on the market, differing in measurement strategy, configuration, and cleaning methods. The two main operational principles available in the market today are UV fluorescence and image analysis.
UV fluorescence uses the natural property of aromatic hydrocarbons to fluoresce when exposed to UV light. Image analysis uses sophisticated camera equipment to identify oil and other particles in a fluid stream. The latter technology is valuable when the need arises to analyze droplet and particle size. Image analysis may be the only option when the oil droplets do not sufficiently fluoresce.
Generally, fluorescence based OiW monitors are available at a lower price point, and therefore accessible to a wider range of applications. More in-depth assessments can be performed utilizing image analysis when droplet size and phase constituent analysis are required. Fluorescence-based technology can provide representative OiW concentrations. OiW monitor configurations can be arranged into two broad categories: 1) side-stream; and 2) inline probe.
Side-stream configurations redirect a small representative water stream to an external measurement section. Care must be taken to ensure the stream entering the monitor is truly representative of the process stream. A tie-in location where water is turbulent is preferred, such as immediately downstream from an elbow, tee, or pump. If that is not practical and flow is expected to be partially stratified, a quill can be inserted into the center of the pipe to capture a side stream more representative of average conditions in the process stream.
Representative sampling can be particularly challenging in CO2-saturated water streams for a side-stream configuration. Even the small pressure drop across the monitor causes the formation of bubbles that reduces visible and fluorescent light intensity reaching the sensor. A pump can be installed to increase liquid pressure beyond the point of CO2 saturation, but achieving a suitable suction head for the pump can be challenging in those conditions. Gas bubble formation is best controlled in CO2 flood applications by avoiding CO2-saturated streams, but it is possible to account for bubbles in measurement.
Inline probe configurations have the advantage of accessing the process stream directly. Placement guidance is similar to tie-in selection for a side-stream monitor. A point of high turbulence is best. Generally, these are installed into the center of a pipe axially, at a tee where the process stream makes a 90-degree turn. The issue of bubble formation caused by a pressure drop to the measurement section is effectively eliminated. If the process fluid is relatively clean and homogeneous, the inline probe configurations work well. Because the probe is continuously inserted in the process fluid, automated maintenance and cleaning options are limited. For all continuous OiW monitors, fouling of the optical window is a leading cause of poor data quality, so a robust cleaning program is needed. Several cleaning options exist depending on configuration and operating principle.
Ultrasonic cleaning – ultrasonic transducers create high-frequency vibrations that clean the measurement window while in service. Care must be taken in this approach to avoid exciting resonances with the transducer that might damage sensors or the measurement window. Heat generated by ultrasonic energy must be considered as well. Excess heat may damage seals or even interact with the process fluid to promote fouling of the measurement window.
Mechanical cleaning can be manual or automatic with various configurations. Optical windows should be accessible for manual cleaning. Typically, a pipette brush would be used to clean a side-stream unit, whereas inline probes will require users to remove the sensor. Inline probes with auto-insertion/extraction allow a mechanical wipe of the optical window upon actuation without manual intervention.
Chemical cleaning – fouling agents common in upstream oilfield applications include waxy deposits such as asphaltenes and paraffin or mineral deposits such as calcium carbonate or iron sulfide scale. A combination of solvents, surfactants, and oxidizers can be used to clean the optical window. In a side-stream configuration, chemical cleaning can easily be automated. Contact time with cleaning fluids can be optimized for specific fouling conditions. For inline configurations, manual intervention is required.
Fluid jetting cleaning – this type of cleaning directs a nozzle towards the optical window and leverages the fluid force to remove any accumulated material. Fluid jetting can be combined with chemical cleaning by adding chemical to the fluid jet to improve effectiveness. Contact time and the strength of the chemical are important considerations.
Depending on the specific application, careful consideration of the measurement strategy, configuration, and cleaning method of the OiW system is essential. This study was designed to help Occidental understand OiW trends in a water injection station, with the goal of identifying process optimization opportunities. A fluorescence based OiW monitor was sufficient to meet the goals of this study. A site assessment prior to technology deployment found the process conditions were associated with minimal fouling. The study included weekly site visits from NOV personnel. During these visits, manual cleaning was conducted, which was sufficient for the study. In long-term applications, or when it is both costly and impractical to have regular intervention, automatic cleaning systems are essential.
The system chosen for the study was a fluorescence-based sensor from NOV in a side-stream configuration. The monitor adjusts to variable turbidity conditions using a proprietary algorithm that compares fluorescent and transmitted light intensity. To obtain the multiple calibration curves for this, a thorough calibration procedure was conducted over a wide variety of process conditions. During any scheduled or unplanned site visit for system maintenance, calibration checks and updates would be performed as needed.
Leveraging digital technology to solve problems. This study was supported by multiple functions in different locations across both companies, so it was necessary to visualize the data in the cloud. This was accomplished using NOV Max Edge technology with the cloud-based GoConnect equipment monitoring solution. For applications where the data will be used in an automated process, the OiW monitor can also be tied into local control systems.
Another requirement of the study was to have a high-level of confidence in the data. A built-in algorithm monitors the health of the OiW monitor, ensuring continuous reliable data is being produced. The system alerts users to exceptions, such as the need for cleaning. Cleaning cycles can be initiated:
- On a predetermined schedule with customizable settings based on frequency and duration.
- Automatically based on fouling detection.
- Remotely by manual intervention with the Max Edge software.
Whenever automated cleaning cycles are not reaching the optimum fluorescence levels, secondary “elevated” alerts are sent to prompt for manual cleaning or system maintenance. NOV personnel or on-site operators can be notified by email or text message when such conditions occur.
PERMIAN CASE STUDY
The NOV OiW Monitor was selected for a 4-week study at a water injection station and central tank battery within one of Occidental’s mature Permian waterflood fields located on the Central Basin Platform in Texas. Produced water from test satellites and a nearby water transfer facility is processed by the facility’s water injection station.
Previous manual samples captured monthly at the site indicated average OiW concentration of approximately 180 ppm, corresponding to roughly 6 bopd being injected back into the reservoir. Variations in these readings, as well as insights from facility operators, raised doubt that the monthly sample set was representative of true OiW concentrations injected at the facility. Two NOV OiW monitors were installed at the facility to acquire and validate OiW concentration data. One monitor was set at the injection pump suction header, and the second monitor was set at the water outlet of a three-phase separator located upstream. The test was divided into two 2-week periods, with a data review taking place between test periods, Fig. 1.
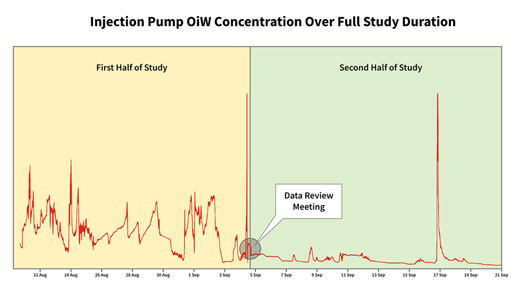
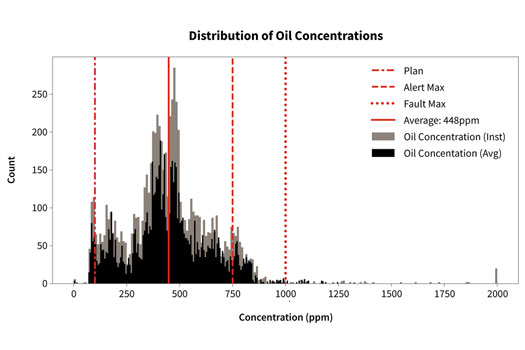
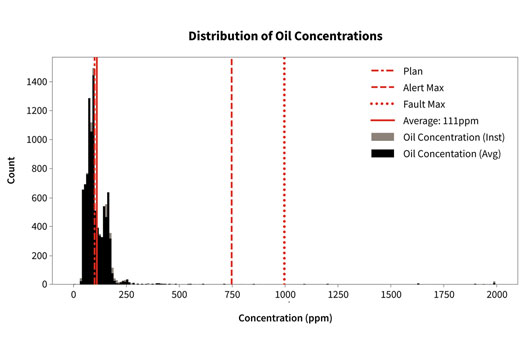
During the first half of testing, an average of 448 ppm was observed passing into the injection system. During this period, just 1% of the recorded data was under the 100 ppm target concentration. In the second half of the testing, an average of 111 ppm was observed. During this period, 39% of the recorded data was under the 100 ppm target concentration. The OiW concentration distributions for the first and second halves of the study are shown in Fig. 2. and Fig. 3.
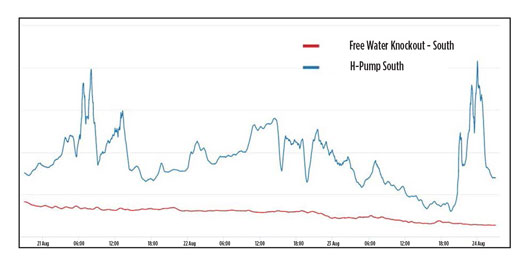
Continuous monitoring enabled Occidental Permian to identify disruptions and discover that process upsets were more frequent than expected. Deploying two units enabled Occidental to analyze multiple process streams simultaneously. The three-phase separator was quickly ruled out as the source of the oil in our injection water. The source of the oil was identified as a nearby water transfer station connected downstream of the separator. Figure 4 below shows two instances of very high OiW concentration at injection while the upstream vessel ran at a stable, low OiW concentration. The event might have not been detected otherwise, but dual monitors allowed field operators to respond quickly and to the correct location, Fig. 4.
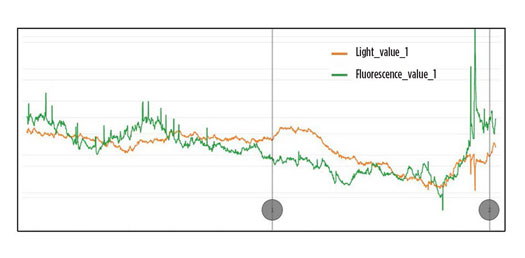
An OiW monitoring system with a robust fouling-detection and cleaning-response process provides users with confidence that the data are valid. For example, when the light and fluorescence values were trending in a signature indicating the optical lens was beginning to foul, the system automatically sent an email and SMS alert to the support team prompting that cleaning was necessary to maintain accuracy and reliability of the measurements, Fig. 5. “Occidental was looking for high-quality data they could rely on. At the end of the day, continuous oil-in-water monitoring only adds value if our clients can trust the data,” stated author Austin Wilcox, senior director for NOV.
Lessons learned from OiW monitoring. The visibility of real-time OiW data had a significant impact, as it enabled field operators to respond quickly and efficiently to upset conditions. Beyond decreasing the severity and frequency of upsets, OiW monitoring helped identify the operational changes needed to optimize the process for current facility constraints. In turn, this helped identify and prioritize debottlenecking projects to mitigate facility constraints.
An additional 11 bopd were recovered from produced water during the study. This was accomplished without significant capital expenditure, only smart operational action in response to new process visibility. If capital spending is needed to sustain this improvement, the measured recovery potential provides a simple economic justification. The most attractive water quality projects are generally the ones that result in more oil recovered, but poor water quality can also have expensive consequences on the injection system. Injecting oil and oil-wet solids reduces injectivity, increasing the injection pressure required for a desired flow rate.
This has adverse consequences on reservoir pressure, production, and even mass balance. In a worst case, production shut-ins may be necessary to balance the loss of injection capacity. Workovers and line cleanouts are expensive fixes; it is better to prevent unwanted materials from entering the injection system in the first place. These projects can be justified on a cost reduction basis, but that can become complex as there are often short-term methods available to mitigate the impact of reduced injectivity and delay cleanout work. Unlike the case of incremental oil recovered from a water stream heading to a reservoir, there can be some uncertainty in assessing the value of injection system cleanouts.
CONCLUSION
Real-time OiW monitoring provides the visibility needed to optimize processes in produced water treatment. This short trial and the associated process improvements directed by Occidental field operations have already yielded tangible results in terms of recovered barrels of oil. In this case, no capital investment was needed to achieve these improvements. This level of incremental oil recovered could easily justify capital projects for process optimization.
Viewing the data overlayed with other process parameters is an intuitive way to gain insight into the process. The OiW data can be visually aligned with other on-site process data, such as production flow, tank level, or pressure, which enables visualization of both process and results. For example, the oil concentration can be correlated with the injection stream flow rates, allowing the user to quantify oil lost to injection. Flexible data acquisition, transfer, and visualization is paramount. This is achieved through the NOV Max Edge technology, which is a universal translator, capable of managing virtually any data communication protocols. A system that provides trustworthy, real-time data broadens the applications in which OiW monitoring makes financial sense.


- What's new in production: Lighten up (June)
- Shifting from calendar to usage-based maintenance: Proven results that demand your attention (June)
- First Oil: Renewed enthusiasm exuded in Canada and within IPAA (June)
- Simplified intelligent completion architectures improve zonal control economics (May)
- John Henry vs the steam drill: Will the robots win? (May)
- What's new in production: When everything is going wrong at the same time (April)
- Subsea technology- Corrosion monitoring: From failure to success (February 2024)
- Applying ultra-deep LWD resistivity technology successfully in a SAGD operation (May 2019)
- Adoption of wireless intelligent completions advances (May 2019)
- Majors double down as takeaway crunch eases (April 2019)
- What’s new in well logging and formation evaluation (April 2019)
- Qualification of a 20,000-psi subsea BOP: A collaborative approach (February 2019)

