Satellite/aerial imaging identifies structural anomalies and presence of hydrocarbons
Hydrocarbons, precious metals and diamonds all generate intrinsic emissions and leave distinctive signatures that can be observed on satellite images. These data are processed in the laboratory and their spectrum can be recorded during field surveys. Despite the similarity of chemical composition, the “intrinsic radiation” spectrum has several differences, which makes it possible to distinguish the carbon of coal from the carbon in diamonds.
The company’s Direct Detection Technology (DDT) is applied in two separate stages with written and/or verbal reports, using data obtained during each stage of the process. DDT stage one is the initial identification of anomalous hydrocarbon deposits for a defined area specified by the client, based on data obtained from satellite images. In DDT stage two, a field survey consists of flying a helicopter over the identified hydrocarbon anomalies, to provide information on the exact location of deposit outlines and subsurface bedding depth of productive horizons.
The field expedition includes measuring anomalous deposits using the company’s proprietary GEO-SCAN ML2 detector, installed onboard a helicopter or, in some cases, by ground transport. All of the data obtained, and their interpretations, are then presented on a geological map and 3D image providing final hydrocarbon deposit depth, size, and contour, as well as locations for further exploration and/or development wells.
KAZAKHSTAN SURVEYS
Between 2015 and 2017, a DDT study was conducted in the Republic of Kazakhstan. The technology is known in Kazakhstan as “sub-atomic technology.” The operator of the hydrocarbon concessions is MMD (JSC Mangistaumunaigas) and the subcontractor providing exploration services to MMD was TOO (KAZ-Waterhanters LLP). The subcontractor hired the service provider to perform a complete two-stage survey. The contract was signed between General Director R.A. Magomadov of TOO and senior vice president Oleg Yatsuk of OGD. The added benefits obtained by OGD based on the two-stage DDT surveys was the permission of the subcontractor to publish a condensed version of the report to acknowledge the validity of DDT surveys for detecting and delineating hydrocarbon deposits to considerable depths.
In Kazakhstan, exploration has traditionally depended on seismic reflection surveys with 2D and 3D application, followed by drilling on identified potential subsurface structures and stratigraphy. In 2015, the developed and producing oil fields, Alatube and Atambai-Sartube, were surveyed using DDT to identify hydrocarbon deposits at depths up to 6,000 m. These Kazakhstan oil fields were at least 30 years old, with a substantial number of productive wells and plugged producers. The study served as a pilot project to identify hydrocarbon deposits at these depths. The company was contracted to survey an area of 100 km2 using a stage-one survey.
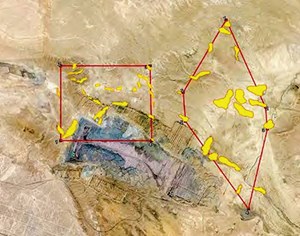
Stage-one survey results. According to the outlined stage-one survey procedures, the client provided OGD with coordinates for the two concession areas, Fig. 1. The provider did not request hydrocarbon exploration data, although a considerable amount of information collected using standard hydrocarbon exploration technologies over the past decades was available. These surveys, with the analysis and interpretation of the data, had been used to identify several drilling locations.
In the process of performing the stage-one survey, over the 100 km2 of the operator’s prospective exploration, it showed strong- and medium-intensity signals from structural anomalies, due to the intrinsic sub-atomic radiation of hydrocarbon-bearing formations. These anomalies indicate the definite presence of hydrocarbons in the subsurface of the client’s concessions. Hydrocarbon anomalies identified during laboratory processing of satellite images are indicated as yellow objects, Fig. 1.
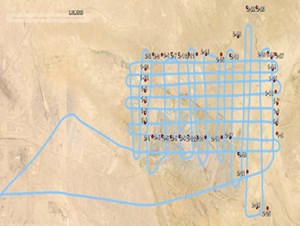
Stage-two survey results. Based on positive stage-one survey results, OGD and the subcontractor decided to run stage-two surveys over both of the operator’s concessions. The proposed grid for the helicopter pass-over of the anomalous areas is shown in Fig. 2.
As is typically the case, the anomalies identified during the stage-two survey are more clearly defined than the satellite images produced in stage one. This is due to the greater mapping sensitivity of hydrocarbon emissions provided by the low-level and closely-spaced helicopter tracts, and the proprietary GEO- SCAN ML2 equipment installed onboard the helicopter.
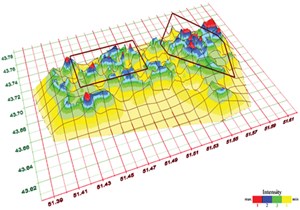
Analyses and interpretation of both the surveys enabled the service provider to identify, and designate red and dark blue, prospective areas for future exploration and commercial development, Fig 3. OGD noted that there were discrepancies between 50 and 90 m during coordinate converging, as well as with GPS inaccuracies in the concession areas.
Based on the intensity of the hydrocarbon anomalies, the service provider outlined the three most prospective areas for further development (S1, S2 and S3). These areas would make it possible to rank the intrinsic emissions by intensity and provide direct geo-references for the hydrocarbon deposits. It would also enable the provider to determine the depth of hydrocarbon-bearing formations at the specific locations and recommend subsequent drilling targets. Finally it would substantially narrow the area for subsequent geophysical activity and exploration drilling. Based on the data (Fig. 3), OGD noted the S1 and S2 areas were within the operator’s concession, but S3 is outside the outline, but adjacent to the leasehold. These areas are considered the most productive, with an estimated accuracy between 85% and 90%.
DETAILED ANALYSIS
Due to the different angles of satellite imaging of the earth’s surface, the primary hydrocarbon anomalies identified in the stage-one survey are somewhat different than data collected during the stage-two survey. However, after a review of Fig. 1 and Fig. 3 data, it became apparent that several additional hydrocarbon anomalies were identified during the stage-two survey.
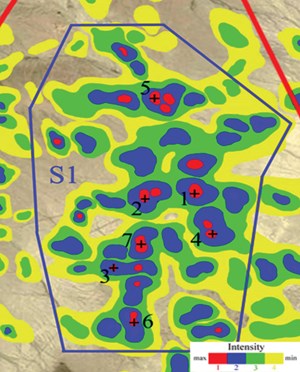
To fully exploit the analysis, an expanded map was produced that highlighted seven highly prospective anomalies that would be excellent locations for exploratory drilling, Fig. 4. These anomalies are located within the contours of maximum intensity anomalies (red areas).
For effective subsequent operation, it is necessary to locate wells within the contours of the identified red and blue anomalies. It has been determined by independent geodynamic model analysis, seismic data, and the results of DDT surveys, that the contours of high-intensity anomalies correspond to highly fractured local zones. However, the survey technology does not merely identify existing zones and structures, but precisely shows which ones contain hydrocarbons, which is superior to other exploration survey methods.
Based on the work, an initial drilling site was recommended at point “2” in S1, and was designated Well No. 42, Fig. 4. To rule out biased assessment, the drilling of this type of well in the existing field is not an automatic developmental procedure predetermined by a grid arrangement. The recommended point was fairly remote, with the distance to the nearest well approximately 1,200 m. In other words, it was determined that the surveys had identified a new hydrocarbon deposit at the site. Nonetheless, the well would be positioned about 1,200 m from the most productive well in Kazakhstan that is producing approximately 1,400 metric tons/day (10,220 bopd).
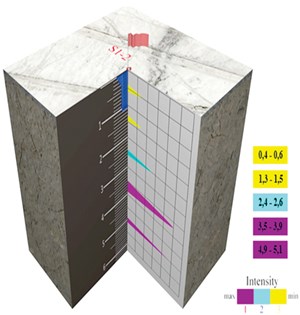
Stacked production zones. The stage-two survey analysis identified five layers of hydrocarbons, with the most productive being between 3,500 to 3,900 m and 4,900 to 5,100 m. To confirm the selection of the most prospective production horizons, a 3D model of the intensity of intrinsic radiation from the hydrocarbon anomalies was produced, along with an intensity scale, Fig. 5. The maximum intrinsic emission intensity is located at the depths of 3.5–3.9 km and 4.9–5.1 km.
Experience has shown when using the DDT technology, that the identified 2D anomalies (Fig. 1) constitute composite signals, based on the productive zones within the given depth interval. Or, the maximum intensity signal identified in the 3.5–3.9-km interval is a material/energetic reflection of the multi-zone deposit within this depth interval.
RESULTS FOR WELL NO. 42
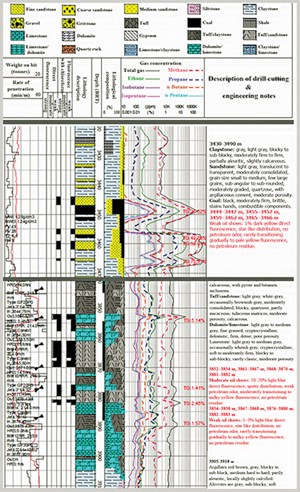
In 2017, Well No. 42 was drilled at the location discussed above to a depth of 3,962 m. Logging conducted in the process of drilling the well recorded the first significant gas productive horizon at 2,420 m, which was associated with coal strata. Hydrocarbon-bearing oil horizons were identified at 3,450 and 3,900 m. These were the depth intervals presented on the 3D block diagram, based on stage-two survey data and analysis. The most characteristic drill cuttings were isolated and illustrated on a lithologic log, Fig. 6.
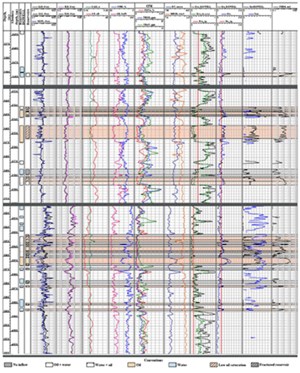
A full suite of geophysical logs was completed, which fully confirmed the presence of a multi-zone reservoir in the section, corresponding to upper and middle Triassic formations, Fig. 7. These results demonstrated the predictive accuracy of DDT technology in determining the boundaries of productive hydrocarbon-bearing horizons, and determining the contours of anomalies, which directly indicate hydrocarbon deposits.
CONCLUSIONS
The drilling of Well No. 42 allowed conclusions to be drawn about using DDT to identify prospective anomalies:
- High accuracy for discovery of hydrocarbon deposits. The extreme points recommended for drilling the first wells are productive, with a probability of no less than 90% to 95%.
- The error in determining the depth boundaries of the identified productive horizons, based on practical experience, does not exceed 5% to 7%. In the present case, it was not more than 1%.
- The low cost, shorter turnaround, and high convergence of survey results with actual data make it possible to confidently plan for the earliest possible opening of new fields, thereby increasing production indices.
After final reports of the survey results were produced, a follow-up conference with the subcontractor and geologists working in the fields concluded that all hydrocarbon anomalies identified by DDT were in existing productive levels or on levels with potential commercial deposits.
Geologists acknowledged that in the area of the DDT surveys, there were different types of tectonic disruptions, which where accurately identified in the reports. The operator and subcontractor both agreed on the need to further modify drilling plans, saving several million dollars, with an additional drilling campaign commencing in 2018.
Operator’s perspective. Mr. Baipakov, director for geology and field development, Mangistaumunaigaz, commented: “Maps of anomalies compiled using the DDT surveys made it possible to identify the most promising sites, based on the level of oil saturation of prospective formations. One well was drilled, based on the data, which did encounter a productive horizon in a predicted interval between 3,500 to 3,900 m.”
After running logs, it was determined the productive interval was situated between 3,444 to 3,902 m. The error predicting the depth of productive strata was just 56 m, with respect to the formation top, and 2 m with respect to the stratum bottom.
The operator’s management team indicated that the predicted formation top/bottom was acceptable for determining the spatial boundaries and depth of horizons.
Due to this success, JSC Mangistaumunaigaz will be drilling two additional deep test wells on six other DDT high-intensity anomalies. ![]()
Acknowledgements
OGD thanks Mr. U. S. Karabalin, board member of KazMunayGas National Co. and Mr. B. A. Imanbaev, general director of JSC Mangistaumunaigaz for their trust and understanding in the course of this experimental hydrocarbon demonstration project.
- What's new in exploration (November 2023)
- What's new in exploration (March 2023)
- The last barrel (January 2023)
- What's new in exploration (January 2023)
- Nova Scotia’s re-starting of exploration is a solid move, says exploration expert (January 2023)
- Exploring annular phase separation phenomena to optimize AICD completion design, to control unwanted effluents (May 2022)

