How curable resin-coated proppant tail-in prevents proppant flowback, reduces workover costs

An in-depth study compares workover equipment and material cost, workover rig and crew expense, and lost-time production in the years following hydraulic fracturing stimulations that used 100% frac sand as the proppant vs. a curable resin-coated proppant tail-in (RCT) for proppant flowback control. All wells in the study are vertical and are artificially lifted by rod pumping. The wells are in AWP field, McMullen County, Texas, in the Olmos formation.
The well data encompass 46 vertical wells during a 10-year time frame, from the early 1990s through May 2013. The authors compared workover equipment and material cost, workover rig and crew expense, and the lost production cost of 23 wells stimulated with 100% frac sand, and 23 wells stimulated with a curable resin-coated tail-in at an average 10.5% of the total volume. The proppant cost for a curable resin-coated tail-in well was $20,000 higher, compared to the proppant cost for a100% frac sand well for these hydraulic fracturing jobs.
The study reveals the long-term economic value of preventing proppant flowback into the wellbore, to reduce workover cost. By using a curable RCT to prevent proppant flowback, this study documents how an operator can pay for the proppant through lower workover cost and increased well uptime.
The net present value (NPV) of the difference in the compared groups for the total workover cost equals $2,770,419. This assumes a 10% discount rate. By subtracting the cost difference of the two proppant types from the NPV of the total workover cost, we see the operator experienced a net value gain of $2,310,419.
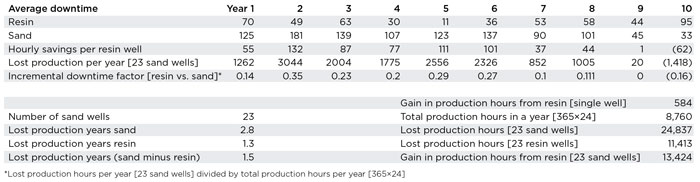
Looking at the sample size, the 100% frac sand wells experienced lost production of 24,837 hr, equating to lost production of one well for 2.8 years. The RCT wells experienced lost production of 11,413 hr, equating to lost production of one well for 1.3 years. The difference between these two groups of wells equals an increase of 13,424 hr that is equivalent to one well’s production for 1.5 years, confirming the long-term economic value of proppant flowback control. The research documented workover equipment and material cost, the workover rig and crew, and lost production from downtime were the most important factors contributing to the difference.
BACKGROUND
AWP field is in McMullen County, Texas, and produces from the Olmos formation. A clastic wedge that gradually thickens southward from Medina and Uvalde counties, the formation is truncated by post-Olmos erosion to more than 1,000 ft in Webb County.1
The Olmos formation reservoir has a complex oil-gas-water pattern, rather than the traditional gas-oil-water pattern. Oil can be found in the upper part of the reservoir and gas in the deeper, more distal part. The reservoir is normally-to-slightly underpressured, having an average fluid-pressure gradient ranging from 0.36 psi/ft to 0.43 psi/ft. Regionally, net sandstone thickness is about 60 ft to 150 ft in depositional packages that vary from 15 mi to 75 mi in length, and 20 mi to 60 mi in width.2, 3
A few horizontal wells have been drilled by various operators in the field, but most of the results have been poor, due to issues associated with staying in zone or partial depletion by offsetting, earlier wells. In the southern, deeper, gas-prone parts of the field, horizontal wells have been more successful. Because AWP field wells are drilled in a tight, low-porosity, low-permeability sand of 0.1 mD or less, with downhole temperatures up to 259°F, oil and gas will not flow naturally.4 Hydraulic fracturing is required. During the paper's study time frame, operators had not drilled many horizontal wells in this field. That has changed with better horizontal drilling technology.
These tight sands are similar to unconventional shale reservoirs, in that they both have very steep initial production decline curves. The value of these wells increases because of refracturing, which can increase production higher than the initial output, even as long as 15 years later. Most of these vertical wells are refractured two to three times, because the stress field changes over time, as the wells are drawn down; refracturing appears to contact a new undrained reservoir. This field remains vital, because most wells are being refraced.
AWP FIELD FRACTURING HISTORY
Production from the Olmos formation was established in the 1920s, and some production from AWP field began in 1975; however, it was not until December 1981 that the actual field discovery well was drilled (Burnett Oil Co.’s Elliot No. 1). Fracture stimulation technology was applied to the tight Olmos sand formation, making oil and gas production from it economic. The field produced oil early in its history, and later produced gas in a step-out to the south.
The Eliott No. 1 was completed with a gelled, water-based hydraulic fracture fluid, using 70,000 lb of 20/40 Ottawa sand and 16,600 lb of 20/40 sintered bauxite. The well produced 250 bopd and 150 Mcfd.5
The initial hydraulic fracturing treatments following the Eliott No. 1 well were smaller jobs, with relatively low proppant concentrations, yielding minimal production. Next, operators used moderately sized stimulation treatments of 60,000 to 160,000 gal of gelled oil, with 70,000 to 410,000 lb of sand or high-strength proppant, yielding good initial production. There was, however, rapid production decline, thereafter.

Operators also tried mini-fracs to calculate the closure stress of the fractures, based on the fracture fluid efficiencies. This approach indicated that the fracture closure time could be long enough to allow all of the proppant to settle to the bottom of the fracture. This understanding led to a high-sand fracture design, with concentrations of 14+ lb/gal for a large part of the designed job. This design provided a settled proppant bed across the pay zone, while compensating for proppant crushing and embedment problems. Because of cost considerations, operators re-evaluated and chose water-based fluid systems for these treatments. A typical frac job included 145,000 gal of gelled water with 1,610,000 lb of sand, which produced results based on calculated expectations.6
By the mid-1980s, with declining oil prices, operators applied less expensive fracture stimulation using gelled water- based designs with 400,000 to 702,000 lb of proppant. Curable resin-coated proppant was included in these designs to minimize or eliminate costly proppant flowback problems, and to maintain better long-term conductivity in the near-wellbore area. The curable resin-coated proppant also helped to address the frac sand crush and embedment problems. The RCT wells’ production met or exceeded the larger 100% frac sand stimulations.7 From 2000 to 2012, two operators performed more than 150 hydraulic fractures and refractures, using gelled water and an average 455,800 lb of total proppant per well on vertical wells. Of these wells, 68% included an RCT, with an average volume of 58,700 lb.
When the AWP field operator, who supplied the data for this study, initiated a refracturing program, the service company found frac sand had flowed back into the wellbore, rather than formation sand as first believed. Because the rod pumps originally had been set at 1,000 ft above the perforations, to prevent pump damage from the frac sand flowback, initial production was not as robust as would have been the case, if the pumps had been set closer to the perforations at 100 ft to 200 ft.
By setting the pumps at no less than 200 ft above the perforations, in conjunction with using an RCT to prevent frac sand flowback and damage to production equipment, the operator was able to increase production more than 70 bopd, in some wells. In marginal wells, production increased more than 30 bopd. The operator used 400,000 lb of total proppant, with 350,000 lb of frac sand and 50,000 lb of curable RCT for refracturing, resulting in a 7× to 20× production uplift.
Recently, with most of the current activity focused on the Eagle Ford shale below the Olmos formation’s AWP field, only 34 wells have been reported to be completed in this field from January 2013 to February 2014, with 23 being vertical wells and 11 being horizontal.8 As of April 2014, operators had drilled 8,482 wells in McMullen County from 1,075 producing leases.9
FLOWBACK OPERATIONAL PROBLEMS
During proppant flowback, which can occur throughout a well’s life cycle, the proppant flows out of the reservoir fractures and back up into the wellbore. If an operator chooses to pump a job with 100% frac sand, proppant flowback is common, requiring well intervention and causing significant, costly nonproductive time caused primarily by workover material expense and crew cost. If the propagated fracture is lost in the near-wellbore area, the reservoir can be damaged irreversibly, causing a partial or total production loss.
Besides rod pump damage, there is also the possibility of proppant flowback damaging surface facilities and filling up the separation equipment. Frac sand can wash out the flowlines and separator dump valves. Facility repairs can require wells to be shut in, resulting in lost production time that cannot be recaptured. As far as the reservoir, when proppant flows back into the near-wellbore area, an operator could lose a portion of the proppant investment. Direct surface facility costs were not included in this study, but they warrant
further investigation.
A worst-case scenario from raw sand flowback is a lost well, with the associated investment loss of $1.5 million for this field’s vertical wells. The right RCT, with the correct bond strength or unconfined compressive strength (UCS), will form a proppant pack that locks the frac sand into the fractures and prevents the sand from coming back up the wellbore.
METHODS AND RESULTS
The authors began this comprehensive study by identifying wells with sufficient documentation for a 10-year examination, comparing workover costs in wells that were completed using two separate hydraulic fracturing approaches: 23 wells were hydraulically fractured with 100% frac sand, and 23 wells were fractured with curable RCT.

The 100% frac sand wells averaged 428,000 lb, and ranged from 250,040 lb to 600,080 lb pumped. The RCT wells averaged a total of 435,000 lb, and ranged from 150,120 lb to 575,120 lb. The percent tail-in used of the total volume pumped averaged 10.5%. Next, the authors scanned 6,999 pages of well files, including the workover-related expenses by invoice, for all 46 wells. They manually entered all of the data into an analysis system. The authors determined the difference between the workover costs for the 100% frac sand wells and the RCT wells during the 10-year time frame.
Table 1 describes three operational problems caused by frac sand flowback—rod and tubing failures, pump changes, and fishing.
Rod and tubing failures. Traditionally, rod and tubing failures fall into two categories: corrosion or rod-and-tubing wear. This study reveals that the RCT wells reduced this failure rate by 72%, leading to lower workover costs and less production downtime.
Pump changes. Whether the 46 wells in this study were completed with 100% frac sand or RCT, all wells were lifted, using a similar sucker rod pumping design. There were 83% fewer pump failures in the RCT wells.
Fishing. In the 100% frac sand wells, fishing was required to retrieve broken rods, in addition to other workover tools and equipment that became stuck during swabbing and workover. The need for fishing was essentially eliminated in the RCT wells, because of a general reduction in workover events and rod failures. During this study’s 10-year history, there was only one fishing job in the RCT wells, compared with 31 fishing events in the 100% frac sand wells. Besides these three workover events listed above—rod and tubing failures, pump changes, and fishing—all of the workover categories and their related costs for maintaining the wells were captured in this study.
Gain in production hours. One of the major challenges for a producing field is to keep production flowing and minimize downtime. Looking at the RCT wells, there were added production days compared with the 100% frac sand wells. Each RCT well had an average 584 additional production days or, for all 23 resin wells, a total of 13,424 additional production hours, Table 2.
Value of increased production. The average single-well boe/year is the annual average production for all wells in the study. The authors multiplied the incremental downtime factor (Table 2) by the single well boe/year to determine the production loss percentage from all of the sand wells. The authors applied a dollar figure by adjusting the boe for the average production stream of $80 for liquids (60%) and $3.50 for natural gas (40%).
The authors could not determine the amount of NGLs, but they believe that if the NGLs were included, the NPV would increase significantly. The 10-year, 10% NPV for the difference in lost production for all 100% frac sand wells is $325,699 or $14,161 per sand well, Table 3.
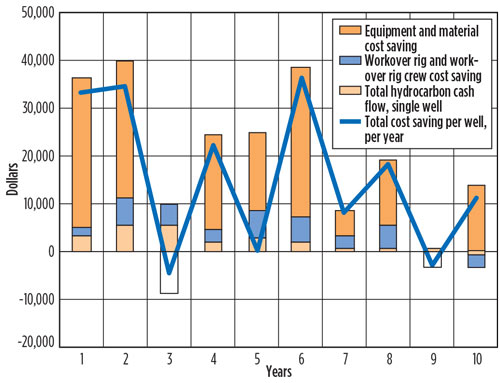
Total workover cost includes the workover equipment and material cost, in addition to the workover rig and workover rig crew cost. The RCT wells had lower workover costs during eight of the 10 years studied. Each RCT well achieved an average saving of $178,431 (gross) vs. the 100% frac sand wells. Even considering the additional $20,000 resin proppant cost per well, and using a 10% NPV, the saving for an RCT well was $100,453. Collectively, all 23 RCT wells saved the operator $4,103,924 (gross) or $2,310,419 with a 10% NPV, minus RCT. Figure 1 details the annual well cost saving. ![]()
TOTAL ECONOMIC VALUE
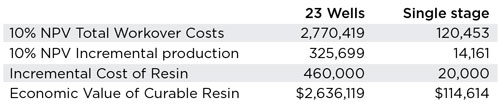
For the AWP field study, the RCT wells yielded $114,614 additional value per well at a 10% NPV, when considering the workover expenses and the lost production because of downtime vs. the 100% sand wells. The additional value for all 23 tail-in wells at this NPV calculation was $2,636,119, Table 4.
ACKNOWLEDGMENT
This article is adapted from URTeC paper 1922860, presented at the Unconventional Resources Technology Conference, Denver, Colo., Aug. 25-27, 2014.
REFERENCES
- Tyler N., “Depositional setting and production characteristics of low-permeability sandstones, Upper Cretaceous Olmos formation, South Texas,” SPE/DOE paper 16424, presented at SPE/DOE Low Permeability Reservoirs Symposium, Denver, Colo., May 18-19, 1987.
- Condon, S.M. and T. S. Dyman, “Geologic assessment of undiscovered conventional oil and gas resources in the upper Cretaceous Navarro and Taylor groups, Western Gulf Province, Texas,” U.S. Geological Survey Digital Data Series DDS-69-H, 2003.
- Kosters, E.C., D. G. Bebout, S. J. Seni, C. M. Garrett, Jr., L. F. Brown, Jr., H. S.Hamlin, S. P. Dutton, S. C. Ruppel, R. J. Finley and N. Tyler, Noel, Atlas of Major Texas Gas Reservoirs, University of Texas, Bureau of Economic Geology, Austin, Tex., 1989, p. 161.
- Barrett, K., L. Fogarty, L. Simoneaux, Project Literature Review, Nov. 5, 2009.
- Pauls, R. W., J. Venditto, P. Chisholm, M. Holtmyer and W. Gregorcyk, “Successful stimulation of the Olmos formation using oil-base fluids and high-proppant concentrations,” SPE paper 13817, presented at the SPE Production Operations Symposium in Oklahoma City, Okla., March 10-12, 1985.
- Conway, M.W., D.E. McMechan, J.M. McGowen, D. Brown, P.T. Chisholm and J.J. Venditto, “Expanding recoverable reserves through refracturing,” SPE paper 14376, presented at the SPE ATCE, Las Vegas, Nev., Sept. 22-26, 1985.
- N.S. Peard, M.L. Macaluso, M.C. Griffin, R. Andress, M.J. Callanan, “Improved fracturing techniques increase productivity in the AWP (Olmos) field, paper SPE 21646 presented at the SPE Production Operations Symposium in Oklahoma City, Okla., Apr. 7-9, 1991.
- DrillingInfo, info.drillinginfo.com.
- Texas-drilling.com/mcmullen county


- What's new in production: Lighten up (June)
- The high-value pull of PMMs (June)
- Oil & gas industry celebrates America’s semiquincentennial! (June)
- Shifting from calendar to usage-based maintenance: Proven results that demand your attention (June)
- First Oil: Renewed enthusiasm exuded in Canada and within IPAA (June)
- What's new in exploration: Financial distractions, investor rationalizations, exploration laments (May)
- Subsea technology- Corrosion monitoring: From failure to success (February 2024)
- Applying ultra-deep LWD resistivity technology successfully in a SAGD operation (May 2019)
- Adoption of wireless intelligent completions advances (May 2019)
- Majors double down as takeaway crunch eases (April 2019)
- What’s new in well logging and formation evaluation (April 2019)
- Qualification of a 20,000-psi subsea BOP: A collaborative approach (February 2019)

