What's new in exploration: I bet you wish you had kept your Exploration priority today!
WILLIAM (BILL) HEAD, CONTRIBUTING EDITOR
The World has not gone crazy these last few days. I guarantee you are seeing the “crazy,” as it has existed for quite some time. Oil and gas are more than the life of civilization; they can define life itself. Observe the use of fuel supply as a weapon. Your existence as a fuel provider can only be held hostage by your own years of collective decisions. Hydrocarbon avA.I.lability in the ground has never been a problem for explorationists.
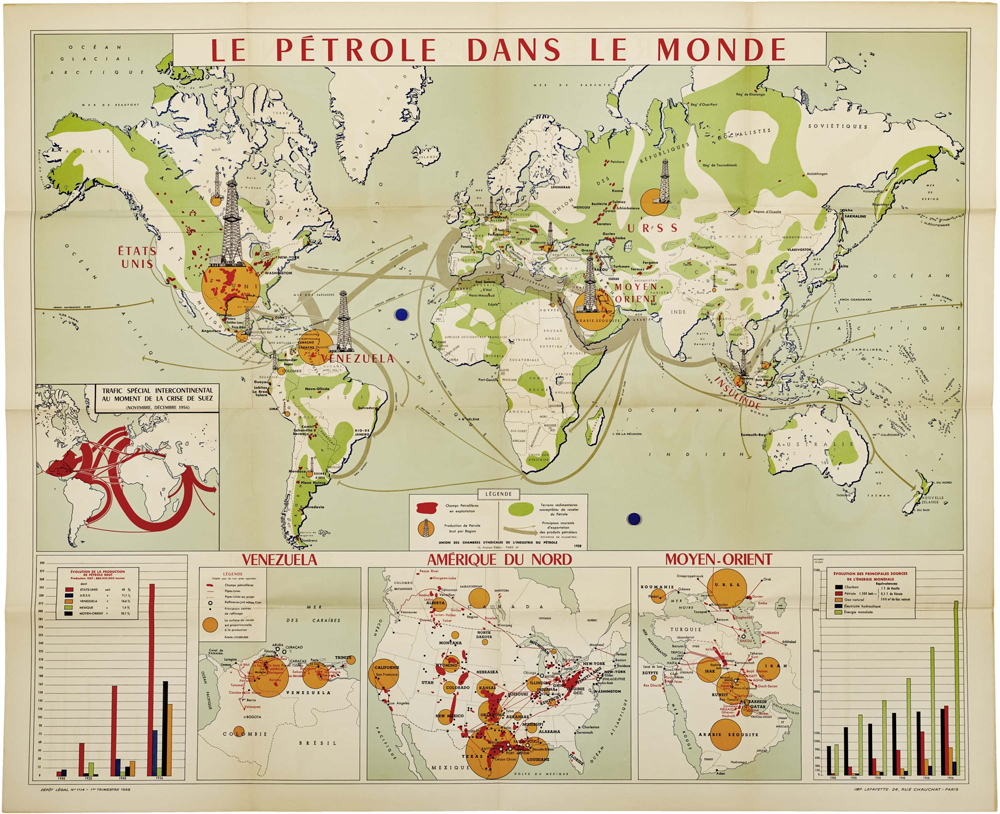
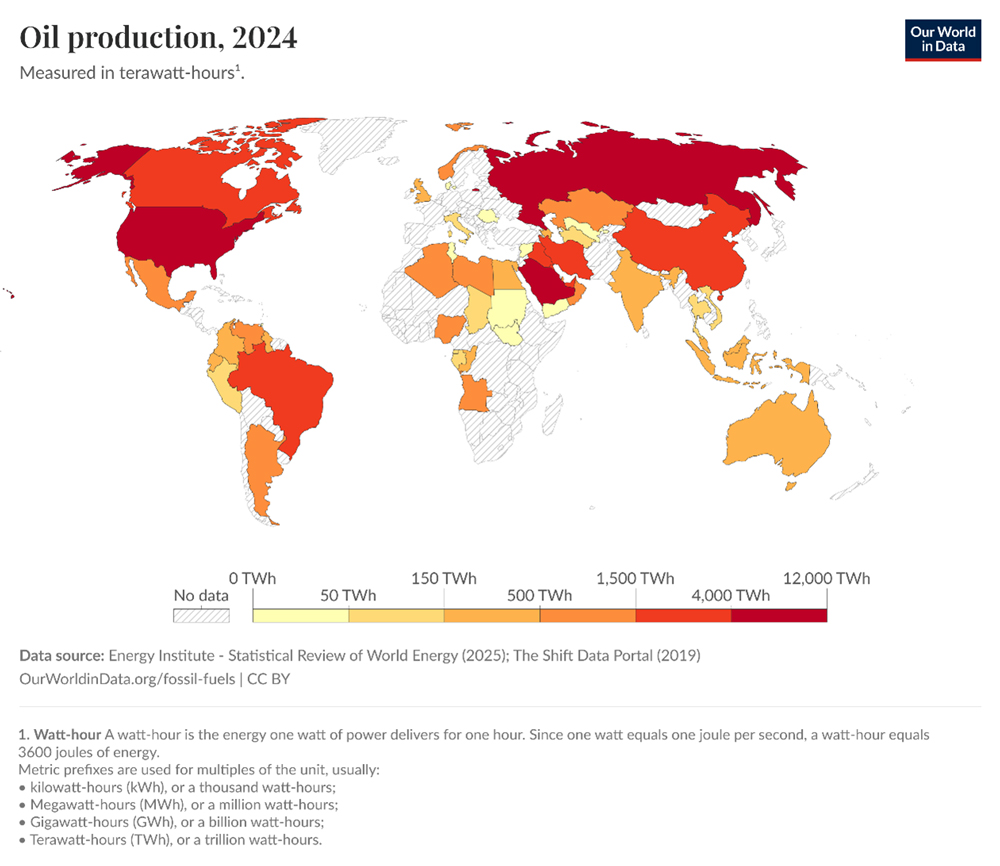
Finding more oil and gas is how I define fun. We may have started the “boom” when Shell Oil’s M. King Hubbard in 1959 warned us agA.I.n that the sky was falling [Hubbert, M. K. (1959). Techniques of prediction with applications to petroleum industry. AAPG Bulletin, 43(7), 1767-1768]. Note the date on the map in Fig. 1—1958. Now, in 2026, the world has come to this: a miserable perception of our O&G efforts, Fig. 2.
The map in Fig. 2 shows the rather woke misdirection in defining our oil supply, as though it is only part of the electrical grid for the “deserving” nations. For example, no way does oil production in China equal the color bar on this illustration. Yes, there is always more oil to find, but not when the fuzzy leadership our industry chooses to align with DEI for political correctness. I told you so!
War is not the best way to increase your oil supply or change the price. Yes, the world is at war. There has been no other choice since 1174 AD.
Interest in the rejuvenation of brownfields as extensions of exploration has waned somewhat for the same reason that new shale fracing plans have been stalled. Cost of effort remA.I.ns around $80/bbl., inflation-adjusted, since the early estimates in the CSPG conference in Calgary in 2006, when the base cost was $60/bbl. [Chen, J., et al., 2006, Integrated Fracture Characterization for a Foothill Tight Gas Reservoir, CSPG/CSEG/CWLS Convention 2006, What's Next? Where is Our Industry Heading?]
Great question, and now we know. As you probably are aware, CO2 for EOR is about dead for new brownfield projects, in spite of the U.S.’s revision of 45Q to significantly up-cash credits for “nasty” oil and gas. Why? It’s the same reason that shale-frac is on hold. [On hold, not dead.] Capital cost estimates exceed the $85 credits in the 45Q offer. Plus, nobody really knows who owns the long-term liability for either the sequestered CO2 or the EOR CO2. I say let it all out, so that trees and grass will prosper, as in the good ole days of the Cretaceous.
I do strongly suggest that everyone revisit existing multiclient seismic libraries. If you have not noticed that seismic data is still relevant, the data in those archives have been dormant for some time now. That means opportunities awA.I.t, where the original purpose for shooting the data probably no longer applies.
Other opportunities exist, albeit at a greater cost, in offshore exploration. Note that West and Southwest Africa are still hot and out of range of Iranian or Houthi missiles. AgA.I.n, I draw attention to that precious offshore area of northern South America, eastward down to the Amazon. There is a lot of seismic data sitting in the salt mines of oil companies for that area. The current consolidation of offshore drillers actually helps with price control, if you have a longer-term plan.
“A.I., A.I., A.I.” and off to work we go… If you have been following this column, you know I am not a fan of A.I. prediction capabilities or substitutes for good judgment. Just when I thought I would recant a bit—only a bit—I drove by a Tesla A.I. cab in Austin last week that ran into an empty street, a parked car, and a curb before stopping. Hmm. I will admit, I use Google A.I. to research a word or topic, then drill down on my own.
A.I. is great for quick access to digital information. That’s the rub. Information must be digitized to be useful. We do not need more copies of Shakespeare online. There have been “analog” attempts to collect references from across sources, but they have yet to be included in A.I. See this example for analogs to improve your reservoir tools: https://pubs.usgs.gov/of/1986/0170/report.pdf.
How about the public well log libraries [TX RRC]? Do you think A.I. can calculate Rwa on its own from RRC E-logs and headers? No, at least not yet. Perhaps it can make a map while you’re making coffee? Not yet. What’s Rwa, you ask? Rwa is the apparent water resistivity near the borehole associated with all reservoir fluids. Rwa is an important metric for determining oil saturation in reservoirs.
Not yet in A.I. are these publications:
A. Rwa distribution also has utility in predicting oil-field-related subsurface water movement, i.e., oil migration.
Head, W. J., & R. H. Merkel, “Hydrologic characteristics of the Madison Limestone, the Minnelusa Formation, and equivalent rocks, as determined by well-logging formation evaluation,” Wyoming, Montana, South Dakota, and North Dakota: U.S. Geological Survey Journal of Research, 5(4), 473-485, 1977.
B. Perhaps formation temperatures from those oil field well logs could be useful to predict trapped reservoirs?
Head, W.J., K. T. Kilty, and R. K. Knottek, R.K., “Maps showing formation temperatures and configurations of the tops of the Minnelusa Formation and the Madison Limestone, Powder River basin, Wyoming, Montana, and adjacent areas,” U.S. Geological Survey, Miscellaneous Investigations, Map 1-1159, 1979.
C. Or collecting digital data or methodology from publications that might be directly useful to EOR?
Merkel, R.H. and W. J. Head, W.J., “ The use of computerized log analysis to determine in situ lithologic characteristics pertinent to secondary recovery,” Bulletin of Canadian Petroleum Geologists, v. 25(2), May, p. 291-304, 1977.
D. Or, the use of very sensitive fiber optic sensors in VSP work to dissect interpretation resolution in conventional surface seismic surveys with at least one absolute well for control? We have come a long way from simple check-shot surveys. RPSEA funded this work until 2017; it is now being carried forward by, of all places, California.
Paulsson, B. N., “Development of a 400 level 3C clamped downhole seismic receiver array for 3D borehole seismic imaging of gas reservoirs,” Paulsson Geophysical Services Inc., 2006.
Paulsson, B., M. Karrenbach, P. Milligan, A. Goertz, and A. Hardin, “High-resolution 3D seismic imaging, using 3C data from large downhole seismic arrays,” First break, 22(10), 2004.
Our world exploration story is still rather infantile, compared to the exploding technologies around us, even in how we use our stupid computer phones. You can use an app to translate a Russian paper on VSP, circa 1975, or even drop a location pin for your driller to build a pad! You also can show a landowner’s son a lease agreement, when you explain that you are not hunting his dad’s deer!
Related Articles- International E&P shows the way forward (February)
- Regional Report: Focus on Arctic oil and gas sharpened during 2025 (January)
- Rugged, explosion-proof computers safeguard offshore rigs (January)
- What's new in exploration: A fresh look at Venezuela with the benefit of hindsight (January)
- How AI-driven asset management is channeling the sea of data into actionable insights for companies (December 2025)
- Automation and AI will help the Middle East navigate energy's next frontier (December 2025)
- Subsea technology- Corrosion monitoring: From failure to success (February 2024)
- Applying ultra-deep LWD resistivity technology successfully in a SAGD operation (May 2019)
- Adoption of wireless intelligent completions advances (May 2019)
- Majors double down as takeaway crunch eases (April 2019)
- What’s new in well logging and formation evaluation (April 2019)
- Qualification of a 20,000-psi subsea BOP: A collaborative approach (February 2019)

