Flow assurance criticalities and challenges management in Zohr gas field
Working in the large Zohr gas field of deepwater Egypt, PETROBEL and Schlumberger used an integrated multi-phase dynamic model to optimize operating procedures for initial well clean-up and ramp-up to production, before first gas, by testing start-up scenarios, given several well and reservoir uncertainties. The model also optimized the system’s time-dependent operations while accounting for uncertainties associated with controlling parameters to ensure flare system adequacy and mitigate flow assurance risks.

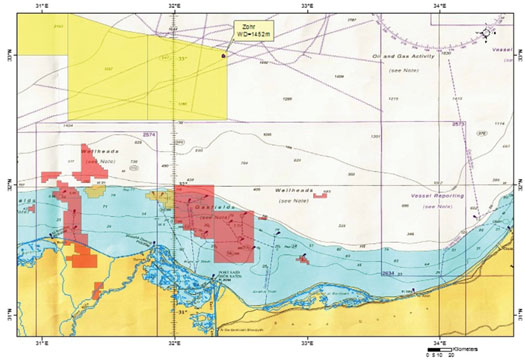
Zohr field is in the Shorouk block, in the offshore East Nile Delta, and belongs to the Eastern Mediterranean basin. The block area is 3,752 km2, with a water depth of 1,400 to 1,600 m and is 100 to 200 km from the shore, Fig. 1. The hydrocarbon phase is a lean biogenic gas (more than 98% methane) associated with extremely limited condensate yield. The project had two phases—the offshore side and the onshore side. The offshore side consists of a high-pressure subsea structure with long-distance sea lines connected to the onshore plant. At the full development phase, there will be 20 subsea wells, and multiple gas-processing facilities. On both onshore and offshore work, the development follows three primary steps: 1) accelerated start-up (ASU) phase; 2) ramp-up to plateau (RUP) phase; and 3) plateau extension (PE). The main objective of the flow assurance strategy is to guarantee the operability of the overall production system in all normal operations, and to provide suitable solutions for expected scenarios that can deviate from normal operating conditions.
Qualified numerical model. A one-dimensional full transient multi-phase model of the system was developed for slug prediction and tracking, pig tracking, multi-fluid flow (for multi-fluid transients as flushing analyses), non-Newtonian fluid characterization (for cold start-up and mud transportation phenomena) and wax and hydrate deposition models, as well as a built-in corrosion model.
The model includes reservoir and wells, subsea production system tools, pipelines and service lines, injection lines, valves and fittings, and topside equipment (separators). Seawater temperature was incorporated, versus depth data and pipeline coating, for accurate modeling of heat transfer.
For extra-long pipelines, such as those used for Zohr, especially for the multi-phase lines, having the bathymetry available minimizes the risk of errors during the field matching stage. The bathymetry will also affect the liquid distribution, and pressure drop calculations. The bathymetry is also used to ensure the developed model represents the real system without oversimplifications. The system developed is discretized in sections, each of them will identify a “node” within which the scalar quantities, such as pressure, temperature and hold-up, are considered to be constant. The vector quantities, such as the velocities of the single phases, are defined in the sections that separate one node from another. Boundary conditions for reservoir, pumps and separators must be considered, both for selection and for the definition of a development scenario, with obvious differences in description detail.
Theoretically, the operation of “nodalizing” a real system represents the passage from a continuous system to a discrete one. In practice, the set of raw data relating to a transportation system is already a discrete set obtainable from topographic surveys (or bathymetric surveys, for offshore lines) or as-built drawings. Therefore, the first control that must be made is to verify that the initial set of geometric data is sufficiently detailed to accurately reproduce the fluid dynamics of the system.
Zohr bathymetric surveys involve more than 200,000 discrete data points to describe the deep inclinations along the line. The real challenge at this stage of modeling is to reproduce the line profile with a reasonable number of nodes. It is to the code user’s advantage to make nodalizations with the smallest possible number of nodes, since the computer time in a run is approximately proportional to the square of the number of nodes. Certain criteria were defined to ensure minimizing computation time would not affect the quality of model predictions.

Hydrate management. High plugging risk locations are downstream of the surface-controlled subsurface safety valve (SCSSV), the production choke, low spots in a flowline where water accumulates, and at the foot of a riser. Hydrates are the main driver of the flow assurance strategy of almost all projects, because they are the only solid with the potential to form a blockage in minutes.
Hydrate management in Zohr field is aimed at avoiding all hydrate formation in the subsea production system during all field operations, from steady-state to transient operations, Fig. 2. This is accomplished by continuous injection of a thermodynamic hydrate inhibitor (THI) (using a monoethylene glycol [MEG]) to shift the hydrate formation curve. In case of a hydrate blockage, hydrate remediation is performed by using dual-sided depressurization to move the system outside of the hydrate stability region and dissociate the hydrate plug in a safe and controlled manner. The objectives of the hydrate management workflow are:
- Calculate total condensed and formation water production
- Monitor flowing and shut-in conditions
- Monitor inhibitor injection rates
- Calculate total MEG inventory and distribution in the pipeline
- Calculate operating margin, based on flowing pressure, temperature conditions and the amount of inhibitor in the system
- Enable more accurate calculation of MEG requirement
- Reduce margins and MEG overdose/reclamation/regeneration
- Recommend dosage, based on the evolution of well shut-in conditions throughout the life of the field
- Calculate available inhibitor over-dosage
- Recommendation for inhibitor injection rate adjustment.
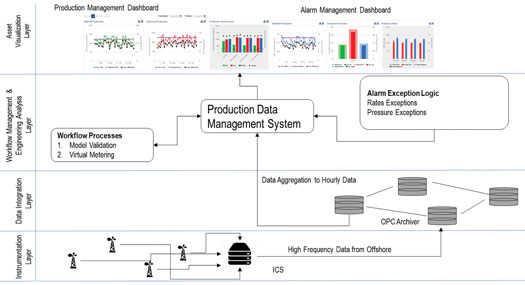
To overcome the fact that the first ten wells are not equipped with flowmeters, a virtual metering system (VMS) was used, Fig. 3. The virtual flow metering (VFM) solution is a model-based flowrate estimator that calculates three-phase flowrates at the wellhead location. The VFM is independent of the physical wet gas meter, with the results reconciled toward fiscal metering topside/onshore.
For phase one, the VMS was used as the primary tool to estimate well rates. For phase two, the VMS was used as a backup for the physical meter or to provide two independent measurements.
Liquid surge management. Liquid surge can be caused by different changes in operational conditions bringing unnecessary complications, hence several operational scenarios need to be examined.
Fluid dynamic instability during steady-state operation. Fluid-dynamic instability in the pipelines can occur when the gas-liquid flow regime enters the slug region. The instability is caused by relatively low gas velocity, compared to the amount of liquid in the pipeline or due to the pipeline bathymetric profile, which causes local liquid accumulation. Fluid-dynamic instabilities can occur during turndown operations or at the end of life, when the gas flowrate is already low and free water flowrate is high.
These fluctuations can be particularly significant when they occur as “severe slugging,” i.e. the sudden arrival of liquid slugs over a short time, followed by a period of the arrival of gas only, resulting from the cyclic occlusion of the flowline cross-section by liquid. A dynamic simulator is used to determine the operating envelope, where it is crucial to operating the system. During the ASU phase until the early RUP phase, no, or relatively low, produced water is expected. Medium-to-high free water cases are expected for the mid-RUP phase until the end of the production life.
The minimum allowable bottomhole pressure (BHP) is calculated from a drop in tubing pressure, based on the dynamic model results, with the well gas flowrate at about 250 MMcfd, the well free water flowrate at about 300 stock tank barrels per day (STBD), and the BHP at around 500 bara. The expected decrease in tubing pressure for such an event is around 85 bara. Lower tubing pressure drop is expected, with a lower well gas flowrate and/or lower BHP.
Nevertheless, a higher tubing pressure drop is expected in relation to the higher well free water flowrate. The maximum allowable total gas flowrate is governed by the maximum allowable pipeline operating pressure, which at an inlet export pipeline or inlet service pipeline is around 250 bara, with the high-integrity pressure protection system (HIPPS) set point at 270 bara (for ASU and optimized ramp-up (ORU) wells).
The maximum allowable total production gas flowrate for production, via the 26-in. nominal pipe size (NPS) export pipeline in target condition, is expected to be around 1,160 MMcfgd with the maximum total free water flowrate at around 300 STBD for any climatic conditions (winter or summer), and the arrival pressure around 84 bara. A minimum recommended turndown gas flowrate is considered when total liquid accumulation in the system is around 10% of the volume pipeline.
The minimum recommended total production gas flowrate for production, via the 26-in. NPS export pipeline prior to the ramp-up or restart operation, is 350 MMcfgd with a maximum total free water flowrate around 300 STBD for any climate conditions (winter or summer), with the arrival pressure around 84 bara.
Liquid slugs due to increase in production flowrate. The liquid surge at onshore arrival can be generated by a change in the steady-state liquid hold-up of the pipeline. A change in the liquid hold-up can be potentially expected during the following operations:
Start-up operations. Ramp-up operations (i.e. switching the operating conditions of the pipeline from turn-down to nominal production flowrate).
Restart operations—resuming production after a shutdown. The high liquid hold-up in a pipeline also occurs when operating in turn-down conditions, hence, the surge generated by ramp-up operations can be significant. The lower the turn-down flowrate, and the longer the turndown rate is maintained, the higher the liquid accumulation is in the pipeline. In addition, the more rapid the ramp-up rate, the higher the amount of liquid surge is expected to arrive onshore. Surge characteristics (mainly the peak flowrate and associated duration) are affected by the duration of the ramp-up operation from turn-down flowrate to nominal flowrate. Rapid ramp-up (fast production choke valve (PCV) opening) serves to minimize the ramp-up duration. However, it tends to maximize the peak surge rate and overall volumes that the slug catcher must manage.
In general, pigging is expected to be the worst case for liquid surge rates arriving onshore.
During pigging operations, most of the liquid accumulation is received simultaneously at onshore arrival (significant liquid surge with a high liquid flowrate peak), resulting in a high surge volume. Also, attention has to be paid to limit the surge volume, especially during restart operations for mid- to end-of-life periods, as liquid accumulation in the pipeline before such operations is expected to be exceedingly high. As long as appropriate restart and ramp-up procedures are followed, no significant surge volumes are expected at onshore arrival during restart and ramp-up operation.
Liquid surge, due to onshore arrival pressure switch. Due to expected reservoir depletion over the field lifetime, arrival pressure at the onshore facilities will be reduced at some point from high-pressure (~86 bara) to low-pressure (~27 bara) mode. This means that there will be less liquid accumulation in the subsea system, and more liquid moved to the processing facilities. A reduction in liquid accumulation is expected to move from high-pressure (HP) to low-pressure (LP) mode. The liquid surge at the onshore arrival can be generated by the pressure switch from high-pressure to low-pressure modes. Nevertheless, the transition from HP to LP mode is expected during the mid-RUP phase to late life. Therefore, liquid surge, due to the onshore arrival pressure switch, is not applicable for ASU/ORU, up to the early RUP phase.
Liquid slugs due to depressurization operation. Export lines may have to be depressurized if the integrity of the system is compromised or if other operations (such as hydrate plug remediation) are required. Liquid surge at onshore arrival can be generated during a depressurization operation. Nevertheless, since no, or low free water is expected during the ASU/ORU/early RUP phases, no major surge issues are expected at onshore arrival during a depressurization operation (from both nominal operations and after shut-in and packing conditions).
Liquid surge due to pigging operation. Pigging operations are required for inspection purposes or liquid hold-up removal/control. Liquid surge at onshore arrival can be generated during a pigging operation. Liquid accumulation in the pipeline will be pushed by the pig and forms a liquid slug in front of the pig. Pigging will displace a significant part of liquid in the flowline. The higher the liquid accumulation in the pipeline before the pigging operation, the higher the liquid surge volume arriving onshore will be. Pigging operations are the most critical operation for slug catcher sizing.
Results. Hydrate prevention is a crucial element of operations at Zohr field. Over the life of the field, up to 3,500 tons/day of MEG are currently envisaged to be injected subsea to inhibit the production fluids against hydrate formation. Better understanding of the hydrate inhibition requirements, along with better monitoring and control of the inhibitor dosage at each well, can result in significant OPEX savings. The available MEG dosage is compared to the dynamic model’s minimum required dosage and the under- or over-dosage calculated. An adjustment in flowrate is suggested to achieve optimized MEG consumption.
The solution implemented by PETROBEL and Schlumberger is based on a combination of virtual metering system (VMS) and MEG optimization, which resulted in reducing the OPEX. The VMS can predict the changes in flowrates quickly, hence the required dosage can be optimized more frequently. If the decision is based on the onshore meter, there will be a lag, due to long tie-back. By adopting the modeling approach, MEG optimization lowered the injected dosage 8%, compared to the results of calculations made using Hammerschmidt’s equation.
The developed model has shown its efficiency when responding to current Egyptian regulations to increase gas production, due to increasing local demands. The initial design of Zohr’s production system, with its current operational strategy, would not be able to handle the increase in back pressure, and risk of system shutdown was identified. The shutdown would have cost estimated minimum losses of 400 MMcfgd to 600 MMcfgd.
Using the developed model to adopt a new strategy that considers the HIPPS maximum allowable pressure, Zohr management was able to avoid those losses and accommodate new government requirements. The Zohr team have a dynamic model that enables them to predict system performance and, hence, dynamically change their strategy, based on new requirements or changes in operational conditions.
- Enhancing Lower Tertiary recovery and profitability: The options – Part 2 (May)
- A Baker Hughes executive assesses the electrification effort (May)
- Nova Scotia’s Premier aims to revive province’s oil and gas activity (May)
- First Oil: OTC soldiers on for another year (May)
- OTC recognizes 2026 Spotlight on New Technology® Award winners (April)
- Umbilical‑less subsea completions: Reduced interface risk with eROCS and OTHOS (April)
- Subsea technology- Corrosion monitoring: From failure to success (February 2024)
- Applying ultra-deep LWD resistivity technology successfully in a SAGD operation (May 2019)
- Adoption of wireless intelligent completions advances (May 2019)
- Majors double down as takeaway crunch eases (April 2019)
- What’s new in well logging and formation evaluation (April 2019)
- Qualification of a 20,000-psi subsea BOP: A collaborative approach (February 2019)

