Special Focus: 2021 Forecast & Review – U.S. Reserves
According to the U.S. Energy Information Administration (EIA), the decline in oil and natural gas prices in 2019 interrupted a two-year trend of rising proved reserves of oil and natural gas in the U.S. Proved reserves of crude oil and lease condensate remained essentially unchanged in 2019 as in 2018 (a slight increase of 0.1%), and proved reserves of natural gas declined 2%. Although the U.S. had enough extensions and discoveries of proved reserves of crude oil and natural gas to replace annual production in 2019, reserves were revised downwards, due to lower prices.
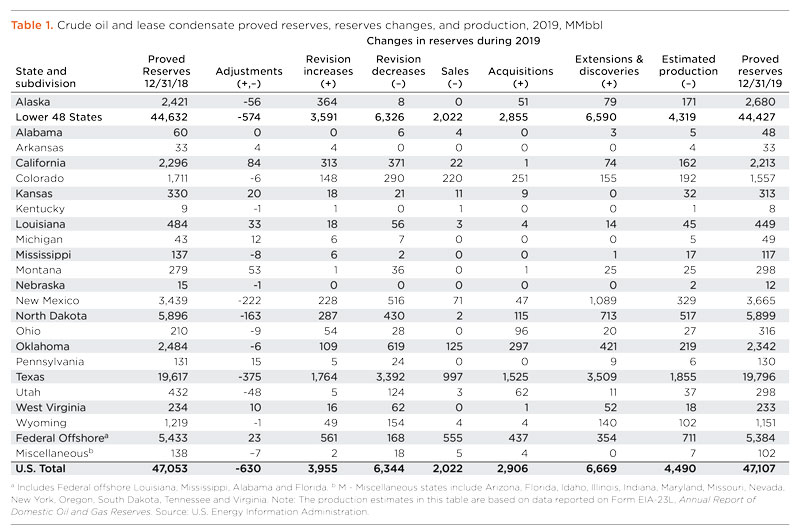
Oil. Proved reserves of crude oil increased 367 MMbbl in 2019, while proved reserves of lease condensate declined 313 MMbbl. This yielded a net gain of 54 MMbbl of proved oil and lease condensate reserves, to 47.1 Bbbl at year-end 2019. At 47.1 Bbbl, U.S. proved oil reserves in 2019 remain at the record level set in 2018. U.S. production of crude oil and lease condensate increased 12.7%, from 2018 to 2019.
In Alaska, producers added 259 MMbbl of proved oil and lease condensate reserves in 2019, the largest net increase of all states. Most reserve additions were made on the North Slope. In New Mexico, producers experienced the second-largest net increase in proved reserves of crude oil and lease condensate during 2019 (226 MMbbl), and Texas had the third-largest (179 MMbbl). The New Mexico reserve additions and most of the Texas reserve gains were made in the Permian basin, the center of the Wolfcamp/Bone Spring shale play. Operators in Ohio had the fourth-largest increase in proved oil reserves (106 MMbbl) in 2019—an increase of 50.5% from 2018. The largest net decrease in proved reserves of crude oil and lease condensate among all states during 2019 was in Colorado (-154 MMbbl).
As of December 2019, seven major shale plays accounted for 49% of all proved oil reserves in the U.S. The Wolfcamp/Bone Spring play in the Permian is the largest oil shale play in the U.S.
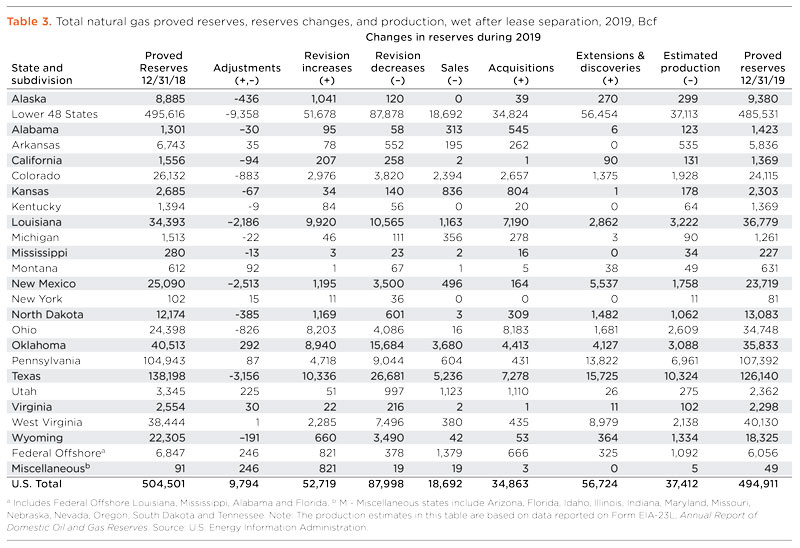
Natural gas. Proved reserves of natural gas decreased 1.9%, from 504.5 Tcf at year-end 2018 to 494.9 Tcf at year-end 2019. This is the first annual decrease in proved reserves of natural gas in the U.S. since 2015, but reserves remain at their second-highest level, ever. Proved reserves of natural gas from shale increased from 68% of the U.S. total in 2018 to 71% at year-end 2019. The largest net gain in proved reserves of U.S. natural gas, by volume, in 2019 was in Ohio (10.4 Tcf) as a result of continuing development of the Utica/Point Pleasant shale play in the Appalachian basin.
Proved natural gas reserves decreased in four of the top eight U.S. natural gas states in 2019. Texas saw the largest net decrease in proved gas reserves of any state, with a decline of 12.1 Tcf. Oklahoma experienced the second-largest net decrease in 2019, dropping by 4.7 Tcf. Declines were a result of net downward revisions to proved gas reserves in 2019. The average U.S. natural gas price declined 21.5% induring 2019, curtailing development plans and reducing the economically recoverable volume of existing proved reserves.
Proved reserves are estimated volumes of hydrocarbon resources that analysis of geologic and engineering data demonstrates with reasonable certainty are recoverable under existing economic and operating conditions. Reserves
estimates change from year to year, as new discoveries are made, as existing fields are thoroughly appraised, as existing reserves are produced, as prices and costs change, and as technologies evolve.
- Baker Hughes executive assesses progress in artificial lift systems (June)
- Shifting from calendar to usage-based maintenance: Proven results that demand your attention (June)
- First Oil: Renewed enthusiasm exuded in Canada and within IPAA (June)
- Enhancing Lower Tertiary recovery and profitability: The options – Part 2 (May)
- A Baker Hughes executive assesses the electrification effort (May)
- Nova Scotia’s Premier aims to revive province’s oil and gas activity (May)
- Subsea technology- Corrosion monitoring: From failure to success (February 2024)
- Applying ultra-deep LWD resistivity technology successfully in a SAGD operation (May 2019)
- Adoption of wireless intelligent completions advances (May 2019)
- Majors double down as takeaway crunch eases (April 2019)
- What’s new in well logging and formation evaluation (April 2019)
- Qualification of a 20,000-psi subsea BOP: A collaborative approach (February 2019)

