Industry at a Glance
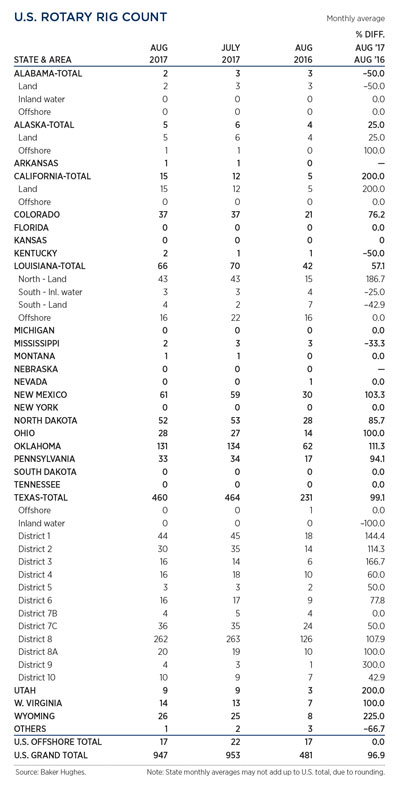
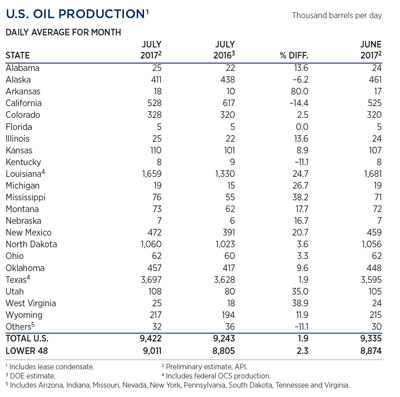
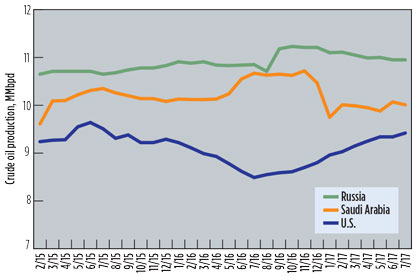
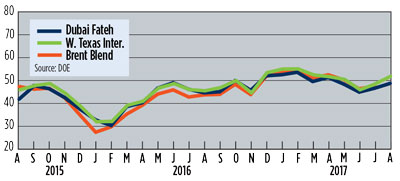
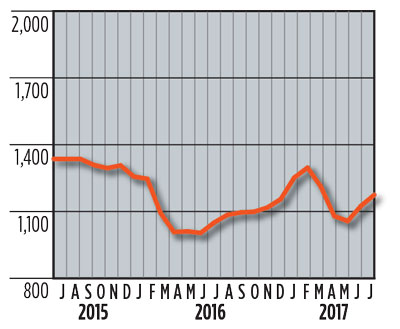
In August, average prices for WTI and Brent surged, with the benchmarks trading at $48.69 and $51.79, respectively, representing gains of 4.6% and 6.9%, compared to the previous month. However, the one-two punch that Hurricane Harvey landed on Texas Gulf Coast refineries, managed to shut down 25% of U.S. crude processing capacity. The reduction in demand pushed WTI back down to $47.05/bbl, while Brent continued to rally, reaching $52.53/bbl. The effect of the storm on oil markets has created a unique opportunity for traders to profit, by shipping crude to different world markets. Oil production in Russia and Saudi Arabia was essentially unchanged, but the U.S. added 80,000 bpd, pushing output up to 9.42 MMbpd. The U.S rig count dropped by six, averaging 947 in August. International activity increased by 49 units, to average 1,168 in July.
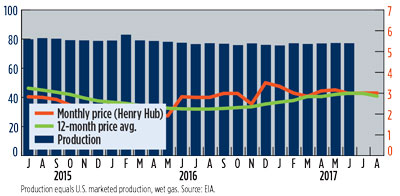
U.S. GAS PRICES ($/MCF) AND PRODUCTION (BCFD) GRAPH
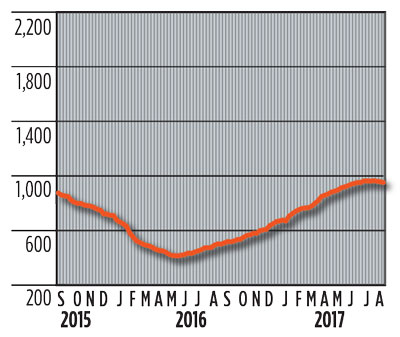
U.S. ROTARY DRILLING RIGS GRAPH
U.S. ROTARY DRILLING RIGS TABLE
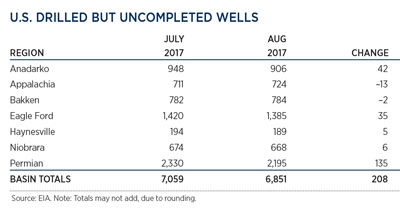
U.S. DRILLED BUT UNCOMPLETED WELLS
U.S. OIL PRODUCTION TABLE
WORLD CRUDE OIL PRODUCTION, TOP THREE PRODUCERS
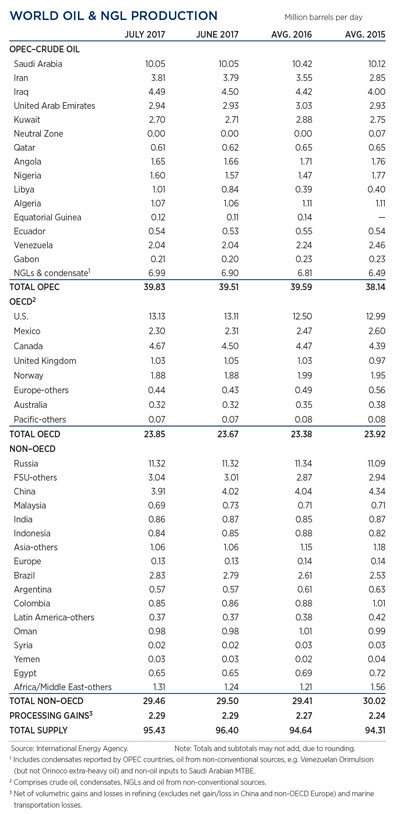
WORLD OIL PRODUCTION TABLE
SELECTED WORLD OIL PRICES GRAPH
INTERNATIONAL ROTARY RIG GRAPH
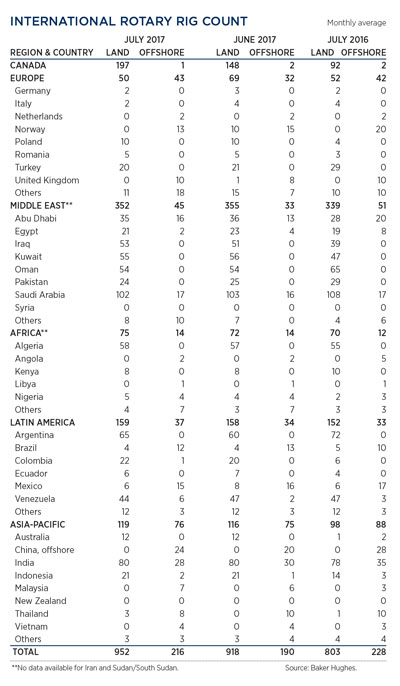
INTERNATIONAL ROTARY RIG TABLE
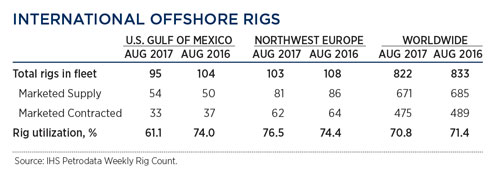
INTERNATIONAL OFFSHORE RIGS TABLE

- Applying ultra-deep LWD resistivity technology successfully in a SAGD operation (May 2019)
- Adoption of wireless intelligent completions advances (May 2019)
- Majors double down as takeaway crunch eases (April 2019)
- What’s new in well logging and formation evaluation (April 2019)
- Qualification of a 20,000-psi subsea BOP: A collaborative approach (February 2019)
- ConocoPhillips’ Greg Leveille sees rapid trajectory of technical advancement continuing (February 2019)

