PC-based simulation optimizes horizontal well development plan
PC-based simulation optimizes horizontal well development planJim Buchwalter* and
Greg Hazlett, Gemini Solutions, Inc., Houston, Texas, and Paul McDonald and Charles Sharp,
Pioneer Natural Resources, Irving, Texas Bottom line. Pioneer Natural Resources, with support from Gemini Solutions, Inc., used quick-turnaround, PC-based reservoir simulation to evaluate infill horizontal development in the tight gas Edward formation in Pawnee field, Bee County, Texas. The reservoir model, refined through history matching, vertical well performance, reliably predicted production rates and flowing tubing head pressures of three horizontal wells. Model predictions indicate that gas recovery (through 2030) will be increased from 54% of gas-in-place with existing vertical wells to nearly 80% with horizontal well development. Reservoir simulation in mature reservoirs with limited reservoir data. Historically, reservoir simulation has been largely ignored for smaller reserve accumulations. Long study time frames that do not provide timely answers, difficult-to-use interfaces and a lack of simulation experts have, until recently, limited reservoir simulation in this situation. User-friendly PC-based simulation systems now make reservoir simulation in this environment practical. Perceptions about inadequate or unreliable data in mature reservoirs also have limited reservoir simulation. A common misconception is that the less accurate the data, the lower the value of reservoir simulation. In reality, the more uncertain the data, the more the simulator is needed to infer what this data should be and what effect these assumptions have on reservoir development. Admittedly, there are more challenges resolving questionable data during history matching. But once these uncertainties are resolved within reasonable error bands, simulation has great value for decision making in mature fields. Field background. Production from the tight gas Edwards formation of Pawnee field began in the early 1960s and continues today. Until recently, all production came from vertical wells. Production lives for some vertical wells are projected to approach 60 years. Horizontal wells were considered to be an attractive alternative, but Pioneer wanted the additional confidence for decision making that reservoir simulation would provide. Gemini Solution’s PC-based simulation system, chosen for this project, includes three components – Apprentice, Merlin and Avalon. Apprentice is a geostatistically based digitizing and mapping package. Merlin is a full-featured black oil simulator with dry gas / gas condensate options. Avalon is a nodal analysis package that is used to develop tubing curves and seamlessly link to the simulator. The goal of the simulation effort was to:
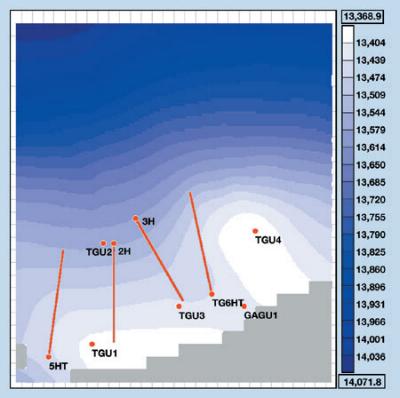
Data for the modeled area. The area modeled has about 95 Bscf of gas-in-place, and encompasses an area with five vertical wells and four new and proposed horizontal wells. The relatively tight formation has permeabilities ranging from 0.0001 – 0.03 millidarcies, and porosities of 2 – 15%. Productive intervals approach 600 ft. Fig. 1 presents a top-of-structure map over the modeled area.
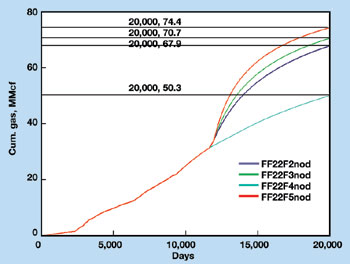
Overall recoveries to date correspond to about 33 Bscf. This low recovery factor is caused primarily by the combination of a low permeability rock, limited drainage area in the vertical wells and a large volume of original gas-in-place. Core porosities, permeabilities and limited well tests were available to establish statistical average starting permeabilities and porosities for the model. Few buildup or pressure transient tests were available. The most reliable data measured in the wells to date have been production rates and flowing tubing pressures. Overcoming data challenges. To model and history match this reservoir, two challenges had to be overcome. First, historical reservoir pressure data, the parameter normally matched, was limited. Second, reservoir porosities and permeabilities vary significantly within cores. However, since Pawnee field is a heterogeneous limestone that does not correlate well between wells, average permeability and porosity values were used initially in the model. These problems had to be solved before an accurate reservoir model could be constructed. The first problem, limited bottomhole pressure data, was solved by including tubing curves for the individual wells and matching the historical tubing pressures on a well-by-well basis. Permeabilities then were varied from well-to-well, and a permeability map was recalculated for each run using a Kriging algorithm. Eventually, a match of the individual well flowing tubing head pressures was obtained. The second problem, the inability to fully integrate the complexity of the existing geological model, was minimized by the fact that all vertical and future horizontal wells penetrate a minimum of several hundred feet of productive interval. Statistically speaking, over these long completion interval distances, good average permeabilities are present, and accurate average permeability and porosity distribution maps were possible. After history matching the vertical wells, the model was used to closely predict the completion rates and flowing tubing head pressures for three horizontal wells recently drilled within the modeled area. The model also was verified by recent well test results. Results: Infill horizontal well placement. After successfully history matching the area, predictive runs were made to establish where additional horizontal wells could be drilled to both accelerate production and increase ultimate recovery. The recovery factor to date in the area modeled is approximately 34%. Continuing to produce the existing vertical wells is projected to yield a 54% recovery factor by the year 2030. Alternatively, the infill drilling of horizontal wells increases recovery to near 80% by the year 2030, besides greatly accelerating production, Fig. 2. The lowest curve corresponds to the case in which only vertical wells are produced. In comparison, all of the horizontal well cases are significantly better.
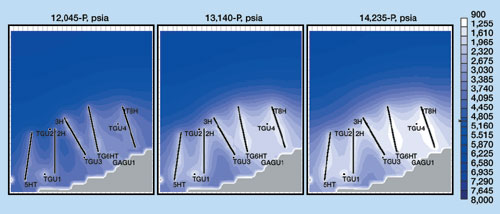
Pressure maps, showing pressure distribution at various times, are shown in Fig. 3 for a case in which four horizontal infill wells are drilled. The map at far left shows current reservoir pressure distribution with production from only vertical wells. In comparison, the map at far right shows pressure distribution after about 2,300 days of production with the new horizontal wells included. Note that the lighter shades of blue-to-white represent depleted areas.
The new horizontal wells are predicted to produce more gas in 2,300 days (about 6.5 years) than the vertical wells drained in the first 30 years. Conclusions. Modeling challenges presented by limited bottomhole pressure data and a complex geologic environment were resolved, and a PC-based reservoir simulation system, requiring only a few weeks effort, reliably matched vertical and horizontal well performance. Performance predictions indicated a significant recovery and economic advantage with horizontal well development. PTD
|
|||||||||||||||||||||||||||
- Applying ultra-deep LWD resistivity technology successfully in a SAGD operation (May 2019)
- Adoption of wireless intelligent completions advances (May 2019)
- Majors double down as takeaway crunch eases (April 2019)
- What’s new in well logging and formation evaluation (April 2019)
- Qualification of a 20,000-psi subsea BOP: A collaborative approach (February 2019)
- ConocoPhillips’ Greg Leveille sees rapid trajectory of technical advancement continuing (February 2019)

