PC-based reservoir simulators enable quick decision on E&P well plans
PRODUCTION / RESERVOIR MANAGEMENTPC-based reservoir simulators enable quick decision on E&P well plansAn overnight evaluation of the economics of sidetracking a disappointing well avoided the expense of putting a rig on standbyJ. L. Buchwalter, W. G. Hazlett and R. E. Calvert, Gemini Solutions, Inc., Houston; and T. M. Campbell and R. A. Molohon, Mariner Energy, Inc., Houston
Simulation Alternatives In the past, only larger, more profitable reservoirs were analyzed with reservoir simulation. This is due to high costs, which result from the following:
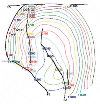
The first two reasons can be eliminated by shifting to high-end PCs that now have the power to run large models in a reasonable time period. Both the PC and simulation software are far less expensive to purchase and support. The third issue – the lack of first-rate interfaces to lower the experience required to complete a study – has only recently been addressed satisfactorily. Case Study This article provides a case study of an exploration prospect that was evaluated using both geological and simulation modeling tools. The operator had drilled and logged an offshore exploration well and needed to decide whether to abandon the well or sidetrack to another location. Gemini Solutions, Inc. (GSI) was asked to simulate the prospect and provide possible flow streams for the economic model. This request, in itself was not particularly unusual since GSI routinely analyzes exploration prospects. However, the study was unique from the standpoint of time allotted – based on rig-cost-driven decision times, the study was completed in just over five hours, including inputting maps, running geostatistics, building single-well and full-field models and running sensitivity cases. Study goals. The exploration play was an offshore, faulted sand deposit at 12,000 ft. Production from an offsetting fault block was used to establish the most likely fluid and rock properties. Uncertainties included original gas, oil and water volumes, compartmentalization, aquifer influx strength, gas-oil ratio, permeability, thickness, porosity and oil/water contact. The initial development well, W1, penetrated 29 ft of net pay, which corresponded to only about half of the anticipated pay. The well was logged successfully, providing additional data for the analysis. A financial analysis showed that the prospect was borderline, based on the recovery factor used to calculate the original economics. One possible alternative to abandoning the well and, therefore, the prospect was to sidetrack the well into an expected thicker section. The operator was in the difficult position of not clearly understanding whether the prospect should be developed or abandoned. GSI was asked at 4 p.m. on a Thursday afternoon if it would study this prospect. And since the rig would go on standby (at $125,000/day) by noon the next day, an overnight answer was required. In fact, a completed study – including digitizing, geostatistical mapping, full-field simulation and numerous sensitivities – was needed before 8 a.m. the next morning. Discussion. In the past, preparing and inputting geological and other data for the study would have taken weeks to complete. However, with user-friendly PC-based mapping, gridding and simulation software now available, companies are able to provide simulation results in a "real time" environment. The software used for this study were Merlin and Apprentice. Apprentice is a digitizing / geostatistic, characterization / mapping package that can be used to generate maps, calculate volumetrics and ex-port grid data to various simulators. Merlin is a full-featured black-oil simulator with pre- and post processors, and a transparent interface to Apprentice. Both packages run on the PC and can effectively build models of 100,000 cells or more on a high-end Pentium PC. GSI received the data at about 6:30 p.m. in its office and organized a staff of three engineers to complete the project. One engineer reviewed data from the operator and corresponded with the client over discrepancies and questions. A second engineer digitized the known maps, calculated volumetric hydrocarbons in place and exported the data to the simulator. A third engineer built a single-well model and ran several cases to examine the sensitivity to different rock and fluid properties. Finally, the single-well model and the Apprentice grids – including faults, well locations and all rock properties – were combined to complete a full-field model. This workflow was completed by 10:30 p.m., a four-hour process. The top of structure map was digitized using the current seismic map. The net thickness map was developed using a geostatistics kriging routine and the best estimate available at the time for area thickness variation. Fig. 1 is the structure map after it was digitized into Apprentice.
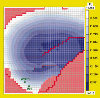
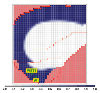
A grid was placed over the structure map and the kriging algorithm was used to populate the grid cells. Figs. 2 and 3 show the results of the kriging step. Note that the grid in both figures is rotated 90° counterclockwise from the digitized data shown in Fig. 1. The oil portion of the reservoir is shown in darker gray. The area of interest lies in the fault block farthest south in the picture. The contact with and productivity of the fault block to the north is uncertain. Later sensitivity cases included placing water in the northernmost fault block.
One of the greatest concerns was the effect faulting would have on water influx. The east-to-west fault, separating the northern and southern fault blocks, was modeled as both open, as shown, and completely sealing, by extending the fault to the east. In this worst case, a sealing fault would significantly reduce the effective influx of water. This second map interpretation represented a more depletion-drive-dependent production mechanism for the producing fault block and established a lower limit for oil recovery. While mapping and gridding was being completed, a single-well model was created in Merlin to establish the recovery for a typical pattern model and to run sensitivities to rock and reservoir variables, which would help in understanding which parameters had the greatest effect on recovery. The effects of permeability and variable rock compressibility were determined to be important parameters during this phase of the study. Merlin allows single-well models to be created in minutes through an automatic setup and, just as quickly, converted to full-field models with Apprentice grids transparently imported. Without these features available in PC-based models, it would be impossible to build these types of sophisticated simulation models in the timeframe required by the operator. Once the Apprentice grids were merged into the single-well model to construct the full-field model, a plan was established for the field using the base-case variables. Production profiles and ultimate recoveries were calculated for this case. Since this was a new prospect, much of the prospect data was uncertain, and it was of greater importance to the operator to establish whether likely minimum recovery cases for the most conservative variable combinations would still yield an economic prospect. Results. Five cases for likely ranges of variables were run before 11 p.m. Thursday night. The resulting plots and maps were then cut and pasted into a PowerPoint presentation. The use of PC-based simulation allows one to make use of readily available presentation software and word processors, thus avoiding the time-consuming task of preparing presentations in the workstation environment. In the past, presentations to companies were limited to completed simulation runs. Invariably, the meeting participants questioned the effect of values used for certain variables and the operating conditions built into the model. This questioning occurred even when these same individuals were responsible for setting these parameters and cases. One advantage of PC-based simulation is the portability of the hardware and software. Laptop computers can now be taken to an office and used to show simulation results through a projector. For this project, the five completed cases were presented at 8 a.m. Friday morning to the engineering / geoscience / management team that commissioned the study. Other management personnel also attended and six additional cases were requested and run during the meeting. By 10 a.m., the operator’s questions had been answered. In total, eight cases were seen as the likely spread for the anticipated production profiles in the reservoir, and remarkably, seven of the eight cases were well above the minimum return required to sidetrack the well and develop the reservoir. A summary of results for the eight cases is shown in Table 1. Of the eight cases, only the case with the limited aquifer and constant rock compressibility was marginally economic, and the other seven cases had good-to-excellent net present values.
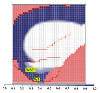
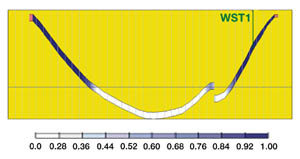
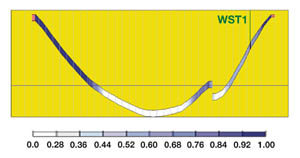
A view of the change in oil saturation with respect to time for the case with full aquifer support and variable compressibility (Case 4) is shown in contour maps (Figs. 3 and 4) and in cross-sections (Figs. 5 and 6). Note that the water sweeps the reservoir quite efficiently for this case, and the majority of the remaining oil is at close to the residual oil saturation to water.
Both the original well, W1, and the proposed sidetrack, WST1, are shown on the contour maps. The quick simulation studies provided the operator with the ability to quantitatively evaluate risks for a new prospect that needed to be sidetracked, and as a result, increased the operator’s confidence in drilling the sidetrack well. The resulting well WST1 was successful, and the operator now has an economic reservoir.
Conclusions. Traditionally, reservoir simulation has been a long process involving the difficult integration of people and tools from several disciplines, including geology, geophysics and reservoir engineering. Based on the results of this study, we conclude:
Acknowledgment This article was adapted from the paper, "Real Time Exploration and Development Well Decisions Using PC Based Reservoir Simulators," which the authors presented at the 46th Annual Southwest Petroleum Short Course, Lubbock, Texas, April 21–22, 1999. The authors
Copyright © 2000 World
Oil |
||||||||||||||||||||||||||||||||||||||||||||||||||||||||||||||||||||||||||||||||||||||||||||||||||||||||||||||||||||||||||||
 Dr.
Jim Buchwalter is cofounder and president of Gemini
Solutions, Inc., of Houston. He spent five years as a reservoir and production engineer in
Texaco’s New Orleans Division, and 10 years as a reservoir engineer in Texaco’s E&P
Technology Department in Houston. He has performed international simulation studies for the
past 15 years, and co-developed Gemini’s Merlin and Apprentice products. Dr. Buchwalter
holds BS and MS degrees in chemical engineering from Ohio State University, and a PhD in
chemical engineering from Rice University.
Dr.
Jim Buchwalter is cofounder and president of Gemini
Solutions, Inc., of Houston. He spent five years as a reservoir and production engineer in
Texaco’s New Orleans Division, and 10 years as a reservoir engineer in Texaco’s E&P
Technology Department in Houston. He has performed international simulation studies for the
past 15 years, and co-developed Gemini’s Merlin and Apprentice products. Dr. Buchwalter
holds BS and MS degrees in chemical engineering from Ohio State University, and a PhD in
chemical engineering from Rice University. Dr.
Greg Hazlett is vice president and manager of
Consulting Services for Gemini Solutions, Inc., where he performs reservoir engineering,
characterization and numerical simulation studies. Previously, Dr. Hazlett was an associate
professor in the Petroleum Engineering Dept. at New Mexico Tech. He spent four years as a
petroleum engineer with Texaco’s E&P Technology Dept. in Houston, Texas, and one
year as a project manager for a Texaco steamflood pilot in Bogota, Colombia. He has also
worked as a drilling engineer for Mobil and a part-time consultant with S. A. Holditch &
Assoc. Dr. Hazlett holds BS, MS and PhD degrees in petroleum engineering from Texas A&M
University.
Dr.
Greg Hazlett is vice president and manager of
Consulting Services for Gemini Solutions, Inc., where he performs reservoir engineering,
characterization and numerical simulation studies. Previously, Dr. Hazlett was an associate
professor in the Petroleum Engineering Dept. at New Mexico Tech. He spent four years as a
petroleum engineer with Texaco’s E&P Technology Dept. in Houston, Texas, and one
year as a project manager for a Texaco steamflood pilot in Bogota, Colombia. He has also
worked as a drilling engineer for Mobil and a part-time consultant with S. A. Holditch &
Assoc. Dr. Hazlett holds BS, MS and PhD degrees in petroleum engineering from Texas A&M
University. Richard
Molohon is a senior evaluation engineer with
Mariner Energy, Inc., located in Houston. He received his BS in petroleum engineering from
the University of Texas in 1977 and has 22 years of experience in worldwide exploration and
development activities. Mr. Molohon currently works the Deepwater Gulf of Mexico region,
performing reservoir, production, basin and economic studies. During his career, he has
worked for Amoco, Tenneco and General Atlantic Resources.
Richard
Molohon is a senior evaluation engineer with
Mariner Energy, Inc., located in Houston. He received his BS in petroleum engineering from
the University of Texas in 1977 and has 22 years of experience in worldwide exploration and
development activities. Mr. Molohon currently works the Deepwater Gulf of Mexico region,
performing reservoir, production, basin and economic studies. During his career, he has
worked for Amoco, Tenneco and General Atlantic Resources. Dr.
Ray Calvert is cofounder and vice president of
Gemini Solutions, Inc. He was a member of the research faculty at the University of Texas
from 1979 to 1981. He later joined, in succession, Getty Oil Co., Texaco’s E&P
Technology Department and Caltex Pacific Indonesia. Dr. Calvert started and supervised the
first simulation group in CPI Indonesia. From his various positions, Dr. Calvert has over 20
years of experience developing, maintaining and using simulation models. He developed the
interface for Gemini’s Merlin product. Dr. Calvert holds BS, MS and PhD degrees in
biophysics from the University of Houston.
Dr.
Ray Calvert is cofounder and vice president of
Gemini Solutions, Inc. He was a member of the research faculty at the University of Texas
from 1979 to 1981. He later joined, in succession, Getty Oil Co., Texaco’s E&P
Technology Department and Caltex Pacific Indonesia. Dr. Calvert started and supervised the
first simulation group in CPI Indonesia. From his various positions, Dr. Calvert has over 20
years of experience developing, maintaining and using simulation models. He developed the
interface for Gemini’s Merlin product. Dr. Calvert holds BS, MS and PhD degrees in
biophysics from the University of Houston. Thomas
M. Campbell, Jr. is deepwater petroleum engineer
team leader for Mariner Energy, Inc., and is involved with reservori modeling, flow
assurance and topside design basis aspects of Gulf of Mexico development projects, and he
has been involved with a joint venture technical assessment of several international
projects, mainly in South America. Mr. Campbell earned BS degrees in chemical engineering
(1982) and petroleum engineering (1985) from Texas A&M University. He served as vice
president, Downtown 1995-1996, for the SPWLA Houston Chapter and he is a member of SPE and
Texas Society of Professional Engineers.
Thomas
M. Campbell, Jr. is deepwater petroleum engineer
team leader for Mariner Energy, Inc., and is involved with reservori modeling, flow
assurance and topside design basis aspects of Gulf of Mexico development projects, and he
has been involved with a joint venture technical assessment of several international
projects, mainly in South America. Mr. Campbell earned BS degrees in chemical engineering
(1982) and petroleum engineering (1985) from Texas A&M University. He served as vice
president, Downtown 1995-1996, for the SPWLA Houston Chapter and he is a member of SPE and
Texas Society of Professional Engineers.- Applying ultra-deep LWD resistivity technology successfully in a SAGD operation (May 2019)
- Adoption of wireless intelligent completions advances (May 2019)
- Majors double down as takeaway crunch eases (April 2019)
- What’s new in well logging and formation evaluation (April 2019)
- Qualification of a 20,000-psi subsea BOP: A collaborative approach (February 2019)
- ConocoPhillips’ Greg Leveille sees rapid trajectory of technical advancement continuing (February 2019)

