January 1999
Industry At A Glance
99-01_breaking-billiter_fig6.html (Jan-1999)
A monthly magazine offering industry news, statistics and technical editorial to the oil and gas drilling, exploration and production industry.
 |
|
|
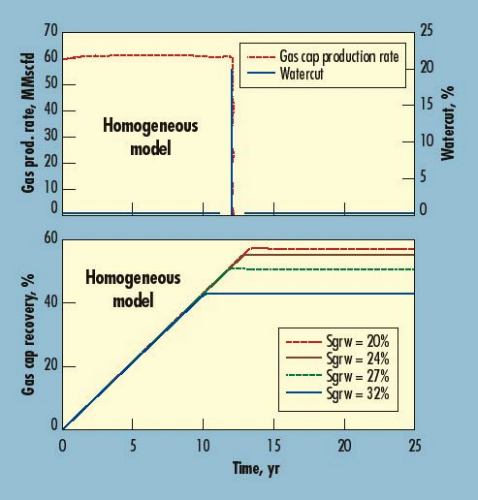
Fig. 6. Gas production rate/watercut of gas cap producer (top) vs. time, and gas cap recovery vs. time for different residual gas saturation to water values (bottom), for the homogeneous model. |
|
|
|
FROM THE ARCHIVE
Copyright © 1999 World Oil
Copyright © 1999 Gulf Publishing Company
- Applying ultra-deep LWD resistivity technology successfully in a SAGD operation (May 2019)
- Adoption of wireless intelligent completions advances (May 2019)
- Majors double down as takeaway crunch eases (April 2019)
- What’s new in well logging and formation evaluation (April 2019)
- Qualification of a 20,000-psi subsea BOP: A collaborative approach (February 2019)
- ConocoPhillips’ Greg Leveille sees rapid trajectory of technical advancement continuing (February 2019)

