Lifecycle performance of wet (subsea) and dry tree systems for Lower Tertiary reservoirs in ultra-deepwater GOM
CHUCK WHITE, ROY SHILLING and PAUL HYATT, Frontier Deepwater, and WILLIAM BRENDLING, BMT
Frontier’s previous World Oil articles (February 2020, April / June 2021) introduced the significant savings and value created by adopting Frontier’s semisubmersible dry tree production system, with its patented movable wellbay (FrPS) and using a phased development approach rather than risky, expensive, subsea development schemes extrapolated from the industry’s Miocene experience. Frontier presented assessments using public domain information and data from BSEE’s Gulf of Mexico database to clarify how, and why, the industry’s efforts after 20 years of appraisal have failed commercially.
In consideration of growing global concern about the actual and potentially harmful impact of offshore oil and gas operations, this series augments the body of evidence arguing for use of the permanently moored dry tree FrPS by presenting results of realistic event domain analyses of operations at a 10-well development over a 30-year project life. While it is widely known that drilling and completing wells with subsea BOPs involves much higher risk for loss of well control, readers will now clearly see the serious difference between the inherent pollution from DP units (MODUs and service vessels) supporting subsea developments versus fields with dry tree wells on permanently moored platforms that could have their power supplied from shore or nearby renewable energy hubs.
CASE STUDY THESIS
In the full study effort, Frontier assessed and compared the resource and operating requirements to appraise, develop and maintain a 10-well Lower Tertiary development in notionally more than a 4,000-ft water depth. This article focuses on field development and operation, wherein the biggest and most polluting tools in the exploitation of the discoveries in the high-pressure Wilcox play are the dynamically positioned mobile offshore drilling units (DP MODUs). There are additional major offshore assets regularly involved in the operations of MODUs, subsea wells, and subsea systems that also depend on DP systems to perform their duties.
This study generally ignores these service vessels, even though a field development option with dry trees supported on a permanently moored floating drilling/production platform will require considerably less support from these field servicing vessels than competing subsea system options.
Field models. An idealized field model was adopted for a study aimed at comparing and contrasting two distinctly different field development concepts for a typically large, complex, HPHT Lower Tertiary reservoir in ultra-deep waters of the Gulf of Mexico. The principal parameters adopted for this study are:
- 30-year project life.
- Ultra-deep water (>4,000 ft).
- Very high-pressure (20 ksi) wells.
- Two drill centers with five wells, each.
- Each well is assumed to be identical in performance.
- Dry tree and wet tree completions are assumed to have the same reliability.
- Subsea BOP reliability is modelled, with 180 days mean time to failure, while the surface BOP is set at 270 days mean time to failure (MUX system versus direct hydraulic controls).
- Completion intervention requirements use the same service life logic.
- Production is halted for a total of six days by a hurricane warning.
- Oil export is 100% reliable.
- The pre-drilling programs for the competing cases are different (see rationale in case descriptions).
- In both cases, each well is assumed to have the same production profile with initial rate of 15,000 bopd, which decays exponentially by 4.86% per quarter, to represent existing BSEE production data for real lower tertiary reservoirs.
- The production rate is defined as a function of the volume of oil produced, so that production halted for an intervention resumes at the same rate as before the intervention was required.
- It is assumed that each well can be side-tracked and re-completed once to extend field life (Recompletion is assumed to reset the production profile to an initial production rate of 15,000 bopd).
Three representative well interventions are modelled. It is assumed that the same interventions are required, at the same frequencies, for both cases studied (i.e., same reliability). However, the tasks required to perform the interventions differ between the two scenarios.
- Tubing clean-out. Required at intervals between two and five years (rectangular distribution). Well production is assumed to stop, as soon as this intervention is deemed as necessary, and not resume until the intervention has been completed.
- Acid stimulation. Required at intervals between two and five years (rectangular distribution) after total production from the reservoir exceeds 100 MMbbl. Well production is assumed to stop as soon as this intervention is deemed necessary, and not resume until the intervention has been completed.
- Production log. Annual for the first seven years of the life of the well and for seven years after completing a sidetrack, postponed for a year after any other intervention. Production continues unabated while this intervention is due but is suspended for most of the duration of the actual intervention.
Occurrence of an intervention request will not interrupt any ongoing field development operation requiring the same resource but has priority over starting a new field development operation (drilling, completion or sidetracking). Tubing clean-out and acid stimulation requests, which halt production, take precedence over production logging.
Dry tree development model. The simulation begins with start of drilling the first development well. The development program for the field, using Frontier’s dry tree (FrPS) technology, is modelled as follows. While the first of two FrPS units is being constructed, the first two development wells are drilled to target depth with production casing cemented by using a DP MODU from the 15 -ksi “fleet”. Simulation time starts when this DP MODU begins work at drill center #1 of the field. The 15-ksi MODU subsequently pre-drills the three remaining wells through cementing a 14-in. protective casing string for the first drill center and temporarily abandons them.
Once the MODU has completed the above drilling, the installation of the first FrPS unit begins. Installation and commissioning of the facility is assumed to take one year. When installed, the first FrPS (FrPS#1) completes the first two wells. Production begins as soon as the first well is completed (and cleaned up). Once production has started, any required interventions on producing wells are performed before beginning work on a new well.
Providing it is not occupied by interventions, FrPS#1 then proceeds to drill out and complete the remaining three wells in drill center #1. Production data gathered from the first two completions can assist the operator in selecting final bottomhole locations for these wells (directional drilling). It is assumed that the operator acquires sufficient dynamic reservoir performance information from the first three wells to sanction phase two. As soon as FrPS#1 has completed well 4, a 15-ksi MODU starts work on drill center #2. This “fleet” MODU is assumed to be available immediately (mobilization pre-planned). The MODU drills wells 6 and 7 to target depth, and pre-drills the 14-in. casing section for wells 8 to 10 at drill center #2.
Once FrPS#1 has completed all five wells at the first drill center, it performs interventions on these wells as required (when available). Once the “fleet” 15-ksi MODU completes pre-drilling tasks for drill center #2, installation of FrPS#2 begins (with one-year duration). Once installed, FrPS#2 begins completing wells 6 and 7, then drilling and completing wells 8 to 10 (pending interventions). A well is scheduled for sidetracking and recompletion the first time its production rate drops below 3,000 bopd. The FrPS rig for the well begins side-tracking as soon as it is available.
Each of the drilling, completion and intervention operations performed by the 15-ksi MODU and the FrPS rigs are described as a sequence of tasks. The following is defined for each task:
- Time needed to complete the task, assuming good weather, with a probability distribution of duration.
- Wind speed, wave height and current speed limits which, if exceeded, cause progress on the task to be suspended.
- A time penalty required to re-start working following a suspension.
- A task may be abandoned in the event of a hurricane forecast. In that case, additional tasks are performed to secure the rig, evacuate, return (once all clear), and resume operations.
- BOPs may be tested, either explicitly by a task or at regular intervals. In the event of a (random) failure being detected, additional tasks are performed to repair the BOP and re-commence work.
Subsea wells with hub platform and 20-ksi DP MODU (WET case). For comparison with the FrPS development program, a WET / subsea development is modelled, as follows. The simulation starts with a 15-ksi MODU pre-drilling the first three wells to target depth at drill center #1. For the WET case, a six-month evaluation period after each of the first two wells (#1 and #2) is assumed to give the operator time to assess the geological results to do a better job in selecting the bottomhole location for the next well.
Still, the bottomhole location for the first three subsea wells is being selected without the benefit of dynamic production data. As a result, only two of the bottomhole locations of the five wells at drill center #1 are selected, with the advantage of having access to actual production data. To select the bottomhole location of the third well using reservoir performance data, the well would need to be delayed until after the first two wells are completed, produced and evaluated for some time.
Once the first three wells have been pre-drilled to target depth, the production facilities (hub FPS and subsea/SURF infrastructure) are installed. This is assumed to take 15 months, including delivery of subsea trees, manifolds, jumpers, flowlines and controls. Once the production facilities have been installed, completion commences. The remainder of development is performed by a 20-ksi MODU. This is assumed to be available immediately following the installation of the production facility (pre-planned) and dedicated by the operator to support field development.
On mobilization, the 20-ksi MODU completes and connects flowlines for the first three wells. It then drills, completes and connects wells 4 and 5 (subject to availability per intervention duties). As soon as the 20-ksi MODU has completed all the well development and any pending intervention requests at the first drill center, it moves to drill center #2 and begins to develop wells 6 to 10. While developing the second drill center, any pending intervention requests at either drill center must be tackled before starting on a new well.
The 20-ksi MODU is assumed to be too expensive to leave idle, so when it is not needed for drilling, completion or intervention, it is immediately demobilized from the field and assumed to be deployed elsewhere to work for the operator. Once the 20-ksi MODU has been demobilized, any new intervention requests will call for remobilization to the field. A rectangular distribution of between 30 and 180 days is assumed for the 20-ksi MODU to return. Once remobilized, the 20-ksi MODU must perform all requested interventions and sidetracks before leaving again.
Field development simulation. Simulation models of the dry and wet cases described above were constructed, using BMT’s Simulated Long term Offshore Oil Production software, SLOOP. These models were used to produce 240 realizations of the 30-year project life for each of the developments. Long-duration time series of the environmental conditions (hurricane warnings, wind, waves, and loop currents) for a representative location in the Gulf of Mexico were used. Different realizations used different year-spans from these time series.
For each model, there were 20 realizations starting in each different month of the year. This averaged the effects of the timing of seasonal influences (such as hurricanes) relative to the development schedule. Each realization used a different random number seed, so that intervals between intervention requests and the task working durations had different values appropriate to their random distributions. From each realization, detailed data on the performance of the field development was collected, including:
- Time (from start of the simulation) of each well development or maintenance activity.
- Field production for each month.
- Delays to well operations, due to weather or due to failure of the BOP.
- Rig and resource utilization requirements.
These data are processed to give statistics for the performance of the modelled field development. The following are some of the key results to provide an overview of the comparison. Part 2 of this study will provide more in-depth results and discussion to provide additional context.
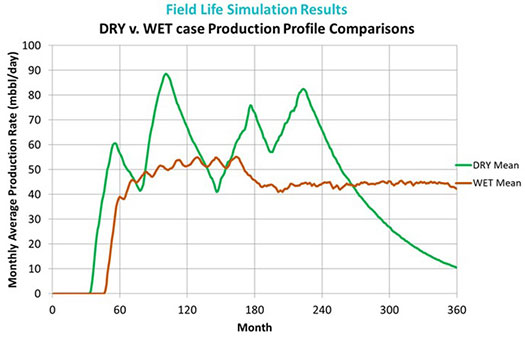
Figure 1 shows the mean of the monthly average production rate. For the FrPS case, there are four distinct peaks in production rate, corresponding to completing all wells at each drill center and, later, sidetrack/recompletion of the wells. For the subsea case, there are no such distinct peaks. Peak production is much lower and occurs much later. It remains suppressed, due to the inability of the single 20K MODU to keep up with the drilling, completion and intervention requests. The main reasons for this are:
- There are two FrPS rigs working, so their workload is only half that of the 20K MODU.
- The FrPS drilling, completion and intervention operations are more efficient and do not require the running / retrieval of drilling, completion, and intervention risers in loop currents and hurricanes.
- The FrPS rigs respond much more quickly to intervention requests as they are always on site – never leaving the field, as the 20K MODU may do.
- Figure 2 shows that this results in significantly higher recovery in the first 20 years of production (the core window for realizing financial value).
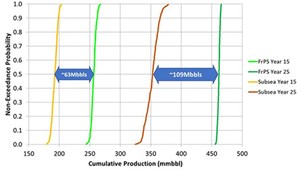 Fig. 2. FrPS vs. WET cumulative production at years 15 and 25.
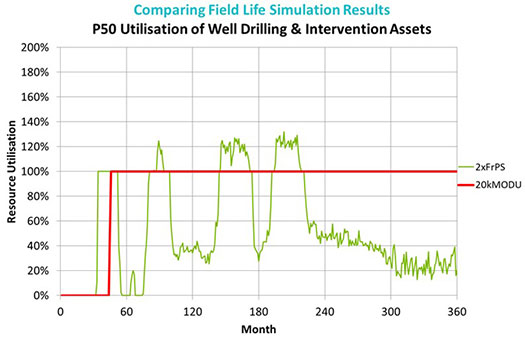
 - Figure 3 shows the 20K MODU is expected to be fully engaged, trying to keep up with operational requirements while combined utilization of the two FrPS units is provides for a lot of spare working capacity.

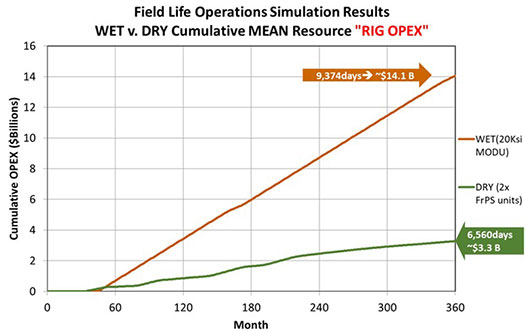
- Figure 4 shows 20K MODU utilization approaches 9,400 days over the 30-year simulation period, adding approximately $11 billion in operating costs (with associated emissions and pollution risk). Through the first 25 years of project life (20 years of production), Frontier’s DRY Tree field development plan (using two FrPS platforms) is shown to recover approximately 31% more of the reserves (109 MMbbl, yielding >$10B more revenue at $100/bbl) from the modeled reservoir, as compared to the analogous WET tree subsea/hub scheme.
BMT SLOOP description. SLOOP was developed to model and evaluate oil and gas operations in harsh environments, such as the North Sea. BMT’s SLOOP simulation tool has been used in support of strategic operations and economic planning by leaders in the oil and gas industry for more than 25 years.
Features of SLOOP enable the simulation of complex field development and operating systems accounting for:
- Well production rates over time
- Well and completion equipment failures
- Subsea equipment and riser failures
- Well intervention and other subsea maintenance resource requirements
- Production system failures and maintenance, and weather-dependent operation
- Storage and export system reliability and weather dependence
- Shuttle tanker operations, including weather dependence.
A realistic representation of the environmental conditions is critical. For the Gulf of Mexico, the following data are typically used:
Hurricane warnings: Making an operation “hurricane-safe” and, if necessary, evacuating a platform may require several days. Therefore, interruptions to operations are triggered by advanced warnings of possible hurricanes. Warnings are more frequent than occurrences of actual hurricane conditions at the site. Statistical techniques are used to represent hurricane warnings, based upon historical tracks data.
Wind and wave data: A long-duration hindcast (100 years) provides correlated time histories of wind speed and wave height. Since hurricane evacuations are modelled separately, the extreme conditions due to hurricanes are removed from the time series and replaced by data from the same season in other years.
Loop current eddies: Historical data on loop eddy currents are used to derive statistics of eddy events. Longer-duration time series are then derived, based upon these statistics.
Field development and operational performance is simulated through drilling/completions, installations and field/well systems maintenance operations, which are described as sequences of tasks. Each task has:
- Resources needed to perform the task.
- An expected (fair weather) duration distribution
- Environment limits, within which the task can commence
- Environment limits which, if exceeded, cause the task to be suspended or abandoned
- Additional work needed to resume a suspended or abandoned task
- The possibility of requiring additional tasks to resume an operation.
Modelling of field production in SLOOP is influenced by:
- New wells being developed
- Production profile of each well, as a function of time
- Attenuation of production, due to failures or interventions required.
- Limitations in export capacity (e.g., tank topping or pipeline failure).
Product export by either shuttle tanker or pipeline may be modelled. SLOOP may also be used to model the receiving end, including environment limits, berth availability, and storage capacity.
To evaluate competing options, SLOOP is used to generate multiple realizations (time histories) of the performance of each scenario. Each realization uses different years of environmental data and different occurrences of random events. Data are collected on the performance of each realization, and, from these, performance statistics are derived.
CONCLUSIONS
Detailed simulations have revealed Frontier’s DRY Tree field development plan (using two FrPS platforms) is expected to recover approximately 31% more of the reserves in the first 20 years of production from the modeled reservoir (yielding >$10 billion more revenue at $100/bbl), as compared to the analogous WET tree subsea/hub scheme due to:
- More efficient (faster, safer, and less costly) drilling and completion operations with a DRY tree system (like the FrPS)
- Simulation results reveal the relatively high number and duration of delays suffered in operations from DP MODUs that slow down the development and exploitation of the reservoir.
- Quicker response to well intervention and recompletion needs by the two FrPS units
- Phased deployment of a 2nd FrPS means that each platform’s rig can easily keep up with the work needed to maximize timely recovery of reserves.
- The 20-ksi DP MODU, being dedicated to constructing, maintaining, and sidetracking / recompleting all wells in the WET case, has trouble keeping up with the demands of the field.
- Though 15-ksi DP MODUs can do pre-drilling, the costly 20-ksi unit takes over all operations, once it arrives at the field.
- The 31% gain in recovered reserves is considered conservative, as the dry and wet tree completions and equipment reliability, except for the BOP, was the same in both cases for this study, where in reality the subsea system will be less reliable, due to the complexity and difficulty of accessing equipment and performing maintenance.
While Frontier’s FrPS DRY tree development is generating at least $10 billion more revenue, the WET/subsea tree scheme is spending more than $10 billion on operations. Fuel costs are in addition, and the DP MODU + hub is consuming almost 9,000 gals more per day than the two FrPS units, combined. So, assuming $4/gal, fuel adds approximately $324 million in costs with 1,800,000 lbs of additional CO2 emissions.
Previous study works highlighted billions in capex savings with Frontier’s DRY tree concepts (see World Oil 2020 and 2021 articles). Even if the initial capex for the WET tree field development was the same as the DRY tree concept, the ENPV of the DRY tree concept would clearly be much higher than that of the WET tree concept. There are key drivers of the DRY tree concept’s obvious ENPV advantage. Significantly shorter drilling and completion times allow the DRY tree FrPS to reach an earlier and much higher peak field production rate. Once on production, the WET tree wells experience many more delays in servicing and many more days of down time than the wells in the DRY Tree case, due to more complex operating requirements and sensitivity to onerous metocean conditions. For the WET tree wells, sidetracking / recompleting to bring on additional reserves is delayed by many years.
This study has assumed that each well may only be sidetracked and recompleted once. However, rig utilization statistics indicate that the two FrPS units have spare availability to perform additional recompletions, if the geology justifies them. This means that declines in production rate could be minimized by replacing poorly performing wells in the DRY case or even that new reserves may be added to the field.
Part 2 of this study will present more detailed simulation results, comparing the two concepts, adding additional context, and understanding of the models and assumptions.
_______________________________________________________
CHUCK WHITE, Frontier’s Executive V.P. and co-founder, is a naval architect (University of Michigan, 1975) with a masters degree in mechanical engineering (University of Houston, 1983). He is a past chairman of SNAME Texas. Mr. White worked for IOCs for over 20 years as a project manager and deepwater technology leader. Since 2000, he has worked primarily on deepwater and natural gas industry projects and technology development. He has led several large joint industry projects, as well as the API global task forces in writing the FPS and riser design RPs. Mr. White also co-chaired creation of the first probabilistic riser design code. He holds multiple U.S. and international patents.
ROY SHILLING, Frontier’s President and co-founder, is an Ocean Engineer with a Mechanical BE (Vanderbilt, 1976) and Ocean Engineering MS (Texas A&M University, 1978). He has over 40 years of deepwater development experience, including 37 years with BP. Throughout his career, Mr. Shilling has worked as a project manager and deepwater technology leader, including Project 20K and BP’s Lower Tertiary projects, like Kaskida and Tiber. During Macondo, he led BP’s containment effort by patenting the free-standing riser system, installed in 51 days and successfully operated with the Helix Producer 1. Mr. Shilling holds multiple U.S. and international patents, and has authored several technical publications.
PAUL HYATT is Frontier’s V.P., drilling and completions, and managing director of TD Solutions. He is a specialist in all phases of well design and operations, from exploration to full field development. He has 41 years of global experience, including technical and project management roles in offshore, deep water, arctic operations, remote heli-rig exploration, HTHP completions and extended-reach design for various major operators and clients. Mr. Hyatt has a BS degree in petroleum engineering with honors from the University of Texas at Austin and is a life member of SPE.
WILLIAM BRENDLING has a PhD in Applied Mathematics and is a Fellow of the Institute of Mathematics and its Application. He has been employed by BMT or predecessor companies for 40+ years. During that time, he has worked on many offshore projects looking at environmental loading and its impact on operational performance. Amongst other software projects, Dr. Brendling is the primary architect of BMT’s SLOOP software for quantitative simulation and assessment of the performance of offshore operations.
- Tethered BOP technology enables DP rigs to drill in shallow water (June)
- Multiphase surface pump boosts revenue for Pemex while reducing costs and environmental impact (June)
- Late-life field management: Repair, repurposing and obsolescence management support sustainable well integrity (June)
- Shifting from calendar to usage-based maintenance: Proven results that demand your attention (June)
- Enhancing Lower Tertiary recovery and profitability: The options – Part 2 (May)
- Executive viewpoint: Methane monitoring goes digital (May)
- Subsea technology- Corrosion monitoring: From failure to success (February 2024)
- Applying ultra-deep LWD resistivity technology successfully in a SAGD operation (May 2019)
- Adoption of wireless intelligent completions advances (May 2019)
- Majors double down as takeaway crunch eases (April 2019)
- What’s new in well logging and formation evaluation (April 2019)
- Qualification of a 20,000-psi subsea BOP: A collaborative approach (February 2019)

