|
Vol. 227 No. 7 |
| |
 |
The K2 project: GOM challenges solved from a drilling engineer’s perspective
Several challenges, including shallow-water flows, drilling through 10,000 ft of salt and hurricanes, were overcome during the K2 development project in the deepwater Gulf of Mexico.
Jack Sanford, Jim Woomer, Jeff Miller and Charles Russell, Eni Petroleum, Houston
The K2 oil field development is 132 mi south of Louisiana’s coastline, primarily within Gulf of Mexico (GOM) Green Canyon Block 562 in water depths from 3,800 to 4,200 ft, Fig. 1. Green Canyon Block 562 is jointly owned by Eni, Anadarko Petroleum, ConocoPhillips and Chevron. This development features three subsea wells in two different clusters with processing at Anadarko’s Marco Polo Tension Leg Platform (TLP) in Green Canyon 608, 7 mi away.
 |
Fig. 1. K2 unit location map.
|
|
DEVELOPMENT HISTORY
Conoco originally discovered productive hydrocarbons at the Reservoir 2 horizon in 1999. Eni (previously AGIP) established operatorship from BP in 2000 and subsequently drilled Wells 2 and 3. An additional exploration sidetrack and a bypass were further drilled to evaluate the field.
Development drilling began after project sanction in 2004. After development drilling, the subsea trees were run utilizing the Q4000 intervention vessel. All future work was performed through the horizontal trees. The completions began three months later.
GEOLOGIC/ RESERVOIR DESCRIPTION
K2 field is on the northwestern edge of the Mississippi fan fold trend. The nearest discoveries within this Miocene fold trend are Mad Dog, Atlantis, Tahiti, and Shenzi. There are two primary horizons, with the main target being below 25,000 ft, TVD. Both targets are below a salt canopy that is more than 10,000 ft thick. Hydrocarbons are trapped subsalt in a three-way fault closure against a deep salt root/ weld zone.
The development targets are Reservoirs 1 and 2. Reservoir 1 lies between 22,800 and 24,400 ft, TVD. It is a very clean, well rounded and sorted sand and is considered massive. Sand thicknesses are up to 100 ft, with high-quality permeability and porosities.
Reservoir 2 lies between 24,400 and 26,400 ft, TVD. Reservoir 2 has a very wide range of grain size, roundness and sorting. There are five primary lobes in Reservoir 2, with large shale breaks in between the lobes. Overall gross thickness is upwards of 350 ft, with net-to-gross ratios ranging between 60% and 80%. Due to the wide range of grain sizes, the permeabilities and porosities vary significantly.
ENVIRONMENTAL CHALLENGES
The environmental challenges include loop currents and hurricanes. The loop current is the Gulf Stream current that comes up from the south between Cuba and the Yucatan peninsula, and goes into the Green Canyon area. It then turns east and goes out into the Atlantic Ocean between Cuba and Florida, Fig. 2.
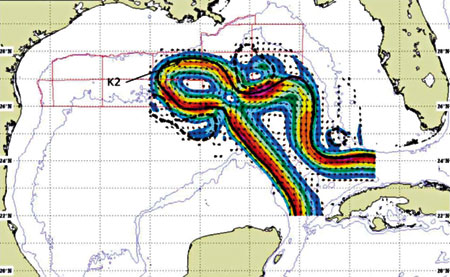 |
Fig. 2. Loop current progression.
|
|
The loop often cuts itself off, which creates an eddy. The eddy or loop currents are often above 3 knots, which shuts down operations, due to riser angle. Over the development period, operations have been stopped for over 60 days for loop/ eddy currents.
The second environmental challenge is hurricanes. During development operations, three major hurricanes, Lili, Katrina and Rita, caused significant delays in operations. Significant means the loss of mooring that required additional recovery operations. The additional time required to recover the moorings after these storms was 167 days, at a cost of $33 million.
DRILLING CHALLENGES
Drilling a 27,000-ft MD, (26,000- ft TVD) well is challenging enough. But, include a shallow-water flow zone, a 10,000-ft salt canopy, an aggressive pore pressure plot and a pressure regression through the main reservoirs, and it becomes very challenging. Each was present at K2.
A detailed well design is summarized as follows, Fig. 3:
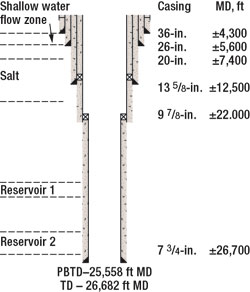 |
Fig. 3. Well design casing diagram.
|
|
- Jet-in 36-in. casing at ±4,300 ft
- Drill 30-in. hole and set 26-in. casing at 5,600 ft
- Drill (pump and dump) 24-in. hole and set 20-in. casing at ± 7,400 ft, through shallow-water flow zone
- Nipple up BOPs
- Swap to synthetic-based mud (SBM)
- Drill 17-in. hole and set 13-5/8-in. casing at ± 12,500 ft, ± 2,000 ft below top of salt
- Drill 12-1/4-in. hole and set 9-7/8-in. casing to ± 22,000 ft, below salt base. Equivalent Mud Weight (EMW) = 15.0 pounds per gallon-equivalent (ppge)
- Drill 8-1/2-in. hole through productive horizons and underream to 9-7/8-in.
- Evaluate productive horizons with logs, sidewall cores and RCI pressure points and samples
- Set 7-3/4-in. casing at ± 26,000 ft
- Run 9-7/8-in. production casing tieback.
Shallow-water flow zone. Pre-drill planning for Well 2’s shallow hazards identified a zone of high potential for a Shallow-Water Flow (SWF) at about ± 2,000 ft below the mud line.
The plan developed for mitigating the shallow-water flow potential was: 1) set 26-in. casing immediately above the zone for additional support, strength, increased wellhead integrity and reducing hole volumes; 2) drill the hole section with seawater and gel sweeps, with the pump-and-dump method utilizing 10.8-ppge kill mud; 3) select a good shale for casing shoe; 4) set 20-in. casing through the SWF interval; and 5) cement the 20-in. casing with a multi-stage cement job consisting of two leads with N2 foam. A tail slurry was used on both casing strings for cement integrity.
Eni identified the SWF as follows: 1) wellhead monitoring with a Remotely Operated Vehicle (ROV); 2) Pressure-While-Drilling (PWD) tools to identify any pressure increase due to water influx or solids; and 3) Logging-While-Drilling (LWD) tools (gamma ray, resistivity and BAT sonic) to identify increases in compressional velocities.
The BAT sonic tool successfully identified the changing formation compaction. This was the first time that useful sonic compression data were acquired from LWD in a 30-in. hole section.
Salt canopy and high base of salt pore pressure. The salt canopy across the development ranges between 10,000 and 12,000 ft thick. The salt top is about 10,350 ft. EMW required to drill to the salt top was 10.8 ppge. Two different methods were used to drill through the salt canopy. Initially, the 13-5/8-in. casing was set immediately, 300 ft, below the salt top. Then the entire salt section was drilled. The 12-1/4-in. hole was enlarged, utilizing both bi-center bits and hole opening devices.
The preferred method sets the 13-5/8-in. casing about 2,000 ft into the salt top, shortening the exposed open-hole salt section and allowing the 12-1/4-in. hole section to be drilled deeper.
SBM and a rotary steerable assembly are both recommended and were utilized to drill the salt canopy. Penetration rates (ROP) ranged from 50 – 150 ft/hr (fph). The mud weight was staged up during drilling to 15.2 ppge. Drilling with the higher mud weights did not affect ROP. After exiting the salt at 21,500 ft, TVD, the openhole section was extended 2,000 ft below the base of salt, to minimize the pressure regression effect. Pressure at the salt base was about 15.0 ppge. The 9-7/8-in. casing was set as a liner with an extended liner lap.
Pressure regression. There is a 5.0-ppge pressure regression between the salt bottom and the TD. The recommended practice of setting the 9-7/8-in. casing 2,000 ft below the base of salt allows the mud weight to be cut to 12.0-ppge, prior to drilling out. This is equivalent to a 4,200-psi hydrostatic reduction.
The first well identified a 4.5-ppge regression between the salt base and productive horizons. In that well, the 9-7/8-in. casing was set 300 ft below the base of salt, and 14.6-ppge mud was used to drill to TD.
The second well was planned exactly like the first, with the casing set immediately below the base of salt. Near the base of salt, prior to casing point, a 20-bbl influx was detected while drilling with 14.2-ppge EMW. Consequently, a 15.2-ppge EMW was required to keep the well dead prior to running casing. This is an equivalent overbalance of 5,000 psi.
The large overbalance occurred in the first two wells, due to the casing point selection. The productive horizons overbalance ranged from 2 to 5 ppge. In subsequent wellbores/ sidetracks, the casing seat selections were revised and the mud densities were reduced in an effort to decrease the high overbalance.
Formation evaluation. Deepwater wells drilled below the base of large salt bodies in the GOM provide several challenges for formation evaluation.
Although managing the drilling parameters ensured good casing shoe integrity and borehole stability, the optimized drilling conditions do not necessarily equate to successful formation evaluation operations. The major problem with subsurface data acquisition is the hydrostatic pressure overbalance required to drill the wells. Determining the producibility, the continuity and assessing the potential flow assurance problems requires an exhaustive formation evaluation program. Obtaining high-quality formation pressure tests and formation samples with low SBM contamination has been the most difficult challenge to overcome.
The development wells were evaluated almost exclusively with LWD services.
Pre-job planning for Well 2 indicated that formation evaluation should be conducted by pipe conveyance. However, wireline logging was attempted and failed. The wireline became stuck as a result of cable drag while logging/ going in the hole. The cable stuck across the massive sands due to the overbalanced condition. The wireline and tools were eventually recovered. All remaining formation evaluation in Well 2 was made by pipe-conveyed logging (PCL). However, the last two wellbores (depths > 26,000 ft, MD) were logged by wireline using capstan. The powered capstan eliminated line crushing.
Formation pressure data and fluid samples with low SBM filtrate contamination were crucial to obtain project sanction. Reservoir fluid samples with less than 10% SBM contamination were required for pressure/ volume/ temperature (PVT) and flow assurance analysis. Over 240 formation pressures and sampling attempts were made in this field. Roughly 200 formation pressure tests and 40 formation samples were attempted with the RCI tool.
Even with the SBM’s stringent fluid loss properties, sample acquisition was challenging, due to the invasion from the extreme pressure overbalance in the oil reservoirs. Several techniques were attempted before finding the solution. The solution was to reduce hydrostatic pressure, via the casing program and adding sized CaCO3 to the active system to minimize fluid loss.
Conventional core. A bypass, in Well 3, was kicked off above the two reservoir sands and was drilled sub-parallel to the original wellbore (~50 ft apart) to acquire a conventional core. Using a full-closure core catcher (with disposable aluminum inner barrels fitted with check valves) three 90-by-4-ft conventional cores were cut. 276 ft of core were recovered (100% recovery). At the time, this was the deepest core successfully recovered in the GOM.
COMPLETION CHALLENGES
K2’s primary completion objective was to deliver low-skin completions (< 6) with very long completion life (> 20 years). Acceleration economic analysis determined that even a slight change in skin points would justify a very large incremental completion cost. Productivity was deemed objective number 1, and all operations were optimized to achieve this objective.
The completion was broken into the following phases:
- Wellbore displacement
- Perforating and surging
- Sand control (frac packing)
Upper completion. Each completion phase was broken down into individual steps and analyzed, using the following methods: peer reviewed (industry and corporate experts), complete the well on paper (CWOP) exercise, risk analysis and a risk register was tabulated. Completion team meetings were held bi-weekly, and all identified risks and challenges were addressed/ mitigated.
Wellbore displacement. Wellbore displacement has two specific challenges: pressure and volume. Due to the well’s MD and configuration, the wellbore and riser volume is greater than the available pit volume at the surface. A very detailed, well-planned operation would be required, including multiple boats, pit management, and coordination between personnel. Additionally, both mechanical and chemical means were required to ensure that the well was as antiseptic as possible.
Second, due to the well’s TVD, large pressure differentials are created with conventional displacement procedures. Even a small delta ppge is equivalent to a large pressure. The pump pressure limitation on the rig utilized was 4,500 psi. An indirect displacement from 13.5-ppge, SBM, to our 10.5-ppge CaBr2 completion fluid in Well 3 was not feasible. The method chosen to mitigate these challenges was a two-stage displacement – an indirect displacement of the riser, and a direct displacement of the wellbore.
Pump pressure and rate limitations were mitigated by using weighted spacers (17.5-ppge barite spacer) and two weighted chemical surfactant spacers (12 ppge). As pressure decreased, the rate was increased to maintain the maximum displacement rate. The displacement results were astounding. Pump pressures were decreased from a modeled 6,800 psi to the actual 3,700 psi at 7 barrels per minute (bpm). A comparison of conventional and proposed displacements can be seen in Fig. 4. No circulating time was required after the short trip bottoms up. The bottoms up NTU readings were 7 NTUs, well below the target clarity reading.
 |
Fig. 4. Displacement comparison.
|
|
The proposed displacement reduced pump pressures, maximizing pump rate and cleaning efficiency due to turbulence, which reduces overall time and maximizes savings for Eni.
Perforating and surging. The perforating and surging phase in Well 3 included setting the sump packer, perforating the well and surging the open perforations with a high-pressure/ volume surge. The challenge with this phase was identifying the highest performing perforating charge, and effectively cleaning out the perforations without sticking the guns or damaging the formation with a fluid loss pill after each operation.
Perforating testing on charges was performed to select the highest performing charge, based on hole size, tunnel length and flowback volume. Three charges were tested in a single-charge apparatus to simulate the well conditions (not including temperature and BHP). The charges were fired through casing, cement and a Castlegate core under confining pressure to simulate the formation. The charges were fired, both balanced and 250-psi underbalanced, and flowed back through the perforation.
The best performing charge was a 32-gram steel charge, which was run in a 5-1/8-in., 14-spf gun. This charge delivered the highest surge volume (51% better than the second place), equal entry hole diameter and slightly lower penetration of the three charges tested. It was also the only gun that was available in 14 spf. As expected, the underbalanced perforating surge volume was twice that of the balanced perforating surge volume. Well 3 was perforated, 250 psi underbalanced, on a closed choke in Reservoir 1. Fluid loss after perforating was ± 60 barrels per hour (bph). A 20-bbl CleanPlug pill was used to eliminate losses.
Next, a 12-bbl, 4,377-psi surge was performed, utilizing an air chamber at 8,000 ft. A 0.3 gal/ perforation volume was utilized, consistent with analogous zones that have achieved the target skin values. The air chamber depth, 8,000 ft, was a tool limitation of 4,500-psi differential across the ball valve (surge tool). The 17,000 ft of workstring below the air chamber (surge chamber) acts as a choke on the surge, due to friction from the uncontrolled flow. The resulting surge was only a 737-psi drawdown at the perforations. However, this underbalance is considered sufficient. Fluid losses increased five-fold to over 250 bph, as compared to the after-perforating losses. Two additional 20-bbl CleanPlug pills were necessary to slow fluid losses below 3 bph.
After surge operations, the wellbore was checked for fill, and none was present.
Sand control. Several sand control options were evaluated for productivity and longevity. A database containing over 2,000 wells was evaluated, and frac packing was selected, because it results in the highest productivity and provides the highest reliability.
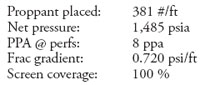
Frac packing at 24,000 ft brings its own series of challenges. There are tool limitations, including injection rate, proppant volume and pressure (P-max). Casing burst must be considered, due to high annulus pressures expected with a live annulus, light completion fluid weight and deep TVD. Additional risk considerations include fracture initiation, tip screen out (TSO), fracture coverage and fluid loss after fracturing.
The gravel pack tools will be pushed to the limit. Pump rates and volumes could be as high as 40 bpm and 350,000 lb of proppant. These values are greater than the tools’ tested limits. P-max is maximum pressure that can be pumped safely without damaging the downhole tools. The calculation uses the weakest link pressure rating times safety factor, plus BHP minus the hydrostatic head. P-max is defined by the following formula:
As defined, it does not consider backside pressure support or net pressure. This is the most conservative approach. P-max was adjusted dynamically throughout the job. The pumping pressure and P-max were often less than 500 psi apart. A graph of the surface pressure versus P-max, using EQ-1, is in Fig. 5.
 |
Fig. 5. Pumping results & P-Max.
|
|
The fracture gradient in K2 is consistent with analogous GOM reservoirs (0.720 psi/ft). However, due to the deep TVD and relatively low BHP, a live annulus will record an extremely high backside pressure. Therefore, the casing was tested to 7,000 psi, and the job was pumped on the pipe rams. The casing pop-offs were set at 6,500 psi. Maximum pressure recorded in Well 3 was 6,000 psi.
Typical delta gradient between sands and shales is between 0.05 and 0.10 psi/ft. Based on K2’s TVD, this equals a delta pressure of 1,250 to 2,500 psi. Fracture containment within the sands most likely occurs until extreme net pressures are achieved. Therefore, height growth should be limited.
Perforation and screen coverage is always a risk in any gravel placement. If both are not covered sufficiently, failure by any mechanism is much more probable. To ensure fracture treatment placement and confirm screen/ perforation coverage, the proppant/ fracture treatment was traced with radioactive tracers. Tracer logs, including density and gamma ray readings, were run in the wash pipe and logged after the fracture treatment. They confirmed in Well 3 that the entire perforation interval was treated, fracture height growth was contained within the sand, and the entire screen was covered.
Excessive fluid loss after frac packing can jeopardize the clean, low-skin completion just achieved by the fracture stimulation. The primary mechanism to mitigate this risk is a mechanical fluid loss device. The device utilized in Well 3’s completion was the FS1 valve. The FS1 is a positive fluid loss device that can hold pressure from both directions. A ball in the gravel pack packer cycles closes after pulling a shifting tool through the FS1 on the wash pipe bottom. The valve can be opened either mechanically (multiple times) or hydraulically (one time) using pressure cycles. The FS1 valve was utilized in conjunction with the Mirage Plug to create a purely intervention-less system.
Frac pack results. The Well 3 completion was frac packed in Reservoir 1. A graphical summary of pumping operations can be seen in Fig 5. Results were as follows:
Upper completion. The primary risk associated with the upper completion is the setting of the production packer and ensuring the well’s productivity. The upper completion was designed to mitigate both these problems. In a conventional system, the production packer is set by placing a plug below the packer to create a differential pressure that causes the packer to set. Setting the plug typically requires wireline, which at 22,000 ft was perceived as a risk.
An intervention-less packer setting mechanism would mitigate this risk. Our system included a Mirage Plug, an Autofill valve, a conventional hydraulic packer, and a polished bore receptacle (PBR) with pinned seals. The Mirage Plug is a salt plug that disappears after setting the packer. This is achieved by cycling open a chamber and exposing the salt plug to fresh water. The Autofill reverse circulating sub allows packer fluid to be reverse-circulated into the tubing-casing annulus.
The first hydraulic pressure cycle closes the Autofill, sets the packer and starts the Mirage plug purging process. Six pressure cycles are required to purge the plug. Nine additional pressure cycles are applied to the FS1 valve to open the well to flow. The intervention-less system performed flawlessly on the first upper completion. The PBR and pinned seals were run to allow the upper completion to be pulled, in subsequent future interventions, without pulling the packer.
The second risk associated with the upper completion is flow assurance. The following equipment was run to assist in mitigating this risk:
- Downhole pressure/ temperature gauge (DHPT)
- Lower 2 downhole chemical injection valves
- Deep-set dome-charged surface control subsurface safety valve (SCSSV) with two independent operating systems
- Upper chemical injection valve.
The DHPT and lower CIMs were run immediately above the production packer around 22,000 ft. Paraffin and asphaltene inhibition is injected at this depth. A dual 1/2-in. flat pack was run to mitigate the high friction pressures required to pump at this depth.
The SCSSV was run at 7,500 ft, which is below the hydrate, paraffin and asphaltene forming depths. A gelled packer fluid was also installed to minimize heat convection effects. The upper CIM was installed immediately above the SCSSV to assist in equalizing the pressure above the SCSSV to open and to inject methanol for hydrate inhibition. The upper completion hardware is shown in Fig. 6.
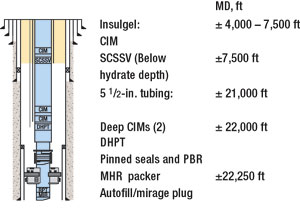 |
Fig. 6. K2 completion schematic.
|
|
PRODUCTIVITY RESULTS
First well results were as follows:
Results were determined from multiple pressure build-up analysis (PBU). The skin has decreased over time to its current stabilized rate and skin. This is common in frac pack completions.
CONCLUSIONS
The following conclusions can be made from specific challenges faced and mitigated throughout the project.
Environmental. Loop current and hurricanes can not be avoided. Incremental costs for these challenges must be included in the initial economic analysis. Downtime/ non-productive time associated with these challenges can exceed $40 million (16% of project costs).
Drilling/ formation evaluation. Shallow-water flows can be mitigated and controlled with proper identification and mitigation techniques. Wireline logging runs can be successful performed at very deep depths (>27,500 ft, MD). Clean formation samples can be acquired utilizing the RCI tool by reducing hydrostatic pressure, adding sized CaCO3 to the active system and applying proper sampling techniques.
Conventional core can be successfully taken at very deep depths. At the time, it was the deepest 4-in. diameter, conventional core in the GOM.
Completion. Preplanning, risk identification and mitigation, should be the first, most important step in any completion operation. High-volume, high-pressure displacements can be successful by utilizing a two-stage approach with weighted chemical spacers.
Surging is required to maximize the productivity of perforations. This is evidenced by the increase of fluid loss after surging. Frac packing is possible at 24,000 ft, TVD, resulting in a very low completion skin. Special consideration to P-max must be evaluated. Furthermore, extremely high backside pressures can be experienced (> 6,000 psi). A Mirage plug, Autofill and a FS1 valve can be utilized to create an intervention-less packer setting system. 
ACKNOWLEDGMENT
This article is derived from paper 18298-PP, which was prepared for presentation at the 2006 Offshore Technology Conference in Houston, Texas, May 1 – 4, 2006.
THE AUTHORS
|
 |
Jack Sanford is a deepwater completions consultant for Eni Petroleum in Houston. Project work at Eni includes the K2 development, and Allegheny and Morpeth completions. He has worked with several operators over the last 16 years (internationally and in the US), including Exxon (Nigeria), Unocal, Amoco and Kerr-McGee. Mr. Sanford is a member of SPE and a registered Professional Engineer in the State of Louisiana. He graduated from Texas A&M University with a BS degree in both geology and petroleum engineering, and an ME degree in petroleum engineering.
|
|
 |
Jim Woomer is a drilling and completion superintendent for Eni Petroleum, based in Houston. He oversees operations in the deepwater Gulf of Mexico. Previously, he worked for Conoco in various locations around the world, and also Exxon in East Texas. Mr Woomer has 28 years of experience in drilling and completions. He is a member of SPE and is a registered Professional Engineer in the State of Texas. He graduated from The Georgia Institute of Technology in 1978 with a BS degree in civil engineering.
|
|
 |
Jeff Miller is a reservoir project manager, Deep Water, for Eni Petroleum in Houston. Previous employers were Union Texas Petroleum and Texaco. He has 24 years of experience in reservoir engineering. He coordinates and supervises the activities of the Reservoir Department in its deepwater Gulf of Mexico and Alaska projects. Mr. Miller is a member of SPE and is a registered Professional Engineer in Texas. He graduated from the University of Missouri at Rolla in 1979 with a BS degree in geological engineering.
|
|
 |
Charles L. Russell is Eni Petroleum’s subsurface manager in Houston. Previous employers were Getty Offshore and Core Laboratories. He has 28 years of experience in exploration, development and operations. He supervises geological operations and petrophysics for deepwater Gulf of Mexico and Alaska projects. Mr. Russell has co-authored several technical papers and served on several customer advisory boards for wireline logging tool development. He has also served as Founding Chairman of Finder User’s Group (database management) and as director and secretary for the Logging Characterization Consortium. Mr. Russell is a member of SPE, and a certified Professional Geologist and licensed geologist in Texas.
|
|
|