World Oil analysis: Significant majority of U.S. imports of Russian “oil” are products
In recent days, we’ve heard considerable rhetoric from U.S. politicians and television news people that a ban on imports of crude and products from Russia to the U.S. needs to be imposed. Some people have argued to the contrary. The purpose of this analysis is not to wade into the merits or problems with such a ban.
Rather, we think it’s important to actually quantify the extent to which the U.S. is importing Russian crude and products. We have heard politicians and television news commentators refer to “Russian oil” as if all imports from that country are strictly crude oil. This is not true. Furthermore, these same politicians and television commentators have bandied about a wide variety of numbers, with great abandon, that they insist are the “actual” levels of U.S. imports of “Russian oil.” These numbers include 600,000 bpd, 500,000 bpd, 450,000 bpd, and even as low as 167,000 bpd (the latter figure still express with outrage by a particular TV commentator).
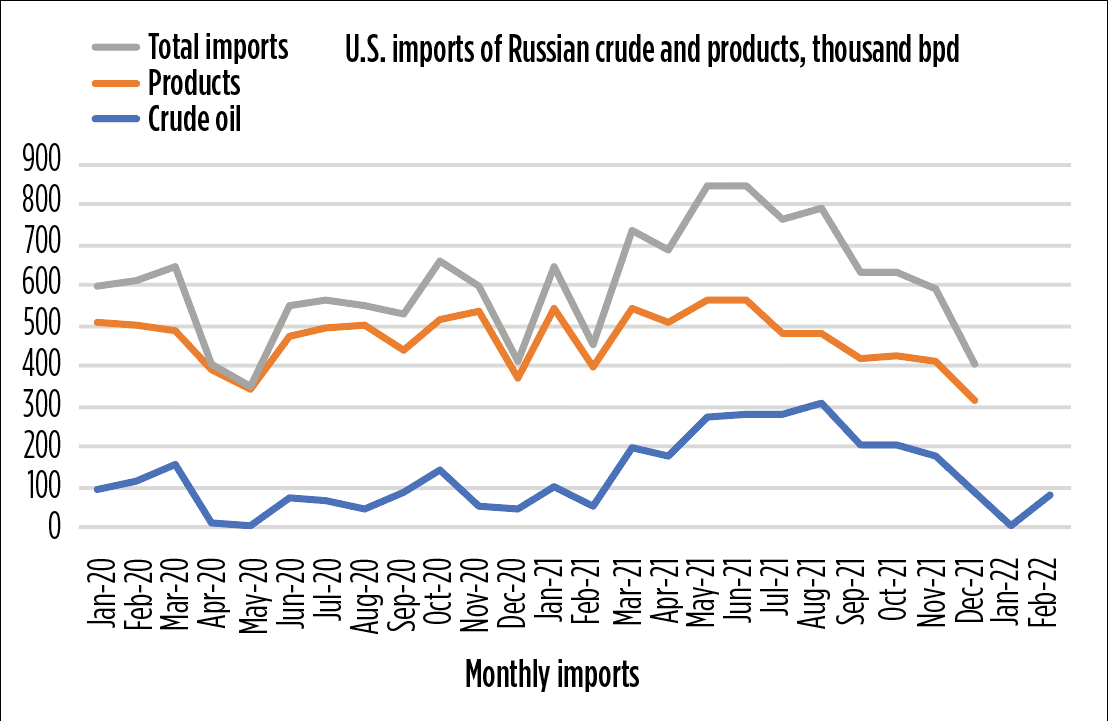
The product share. The truth of the matter is that a significant majority of U.S. imports of “Russian oil” are products. That’s right, a healthy majority of these imports are products and not crude oil. To verify this picture, we dug into data provided by the U.S. Energy Information Administration (EIA). Indeed, we found that U.S. imports of crude and products, combined, averaged 670,000 bpd during 2021, up 24% from 2020’s level of 540,000 bpd—see the chart on this page. Of the 2021 average, 472,000 bpd, or 70%, were products. In 2020, the product share of total imports from Russia was 465,000 bpd, or 86%. So, the amount of products imported per month only rose 7,000 bpd last year, while its share of the total mix fell 16 percentage points.
Crude levels. On the other hand, crude oil imports from Russia averaged just 75,000, or 14% of the total mix during 2002. But their level rose considerably during 2021, averaging 198,000 bpd, or 30% of all imports from Russia. Looking at the y-o-y increase for crude oil imports, they grew 164% (75,000 up to 198,000 bpd).
Seasonal trends. On average, total crude and product imports from Russia tended to run higher in summer months (May through August) and at their lower points during winter. Furthermore, per the EIA’s definition of “U.S. Product Supplied of Crude Oil and Petroleum Products,” the U.S. total supply averaged 18.187 MMbpd in 2020 and 19.768 MMbpd in 2021. Therefore, the Russian crude and products share of these figures averaged 3.0% and 3.4%, respectively. Not a large share, but just enough to make a difference if shortages occur.
We will continue to monitor these levels during the next several weeks, and as the EIA updates figures into January and February 2022. In the meantime, we would like to believe that the politicians and TV commentators will take more care and accuracy in putting out figures on U.S. imports of Russian crude and products—but don’t count on it!

