Using data from drilling to guide completion designs
Among the most difficult challenges faced by a completions engineer are the unexpected results when stimulating a horizontal well. Steps are taken to identify problems, fix what went wrong, and document the process for future lessons learned. Perhaps the pressure during pumping was higher than expected, and the maximum pump rate could not be reached, or a nearby well had a massive pressure spike during pumping, or maybe the well just did not perform, as expected.

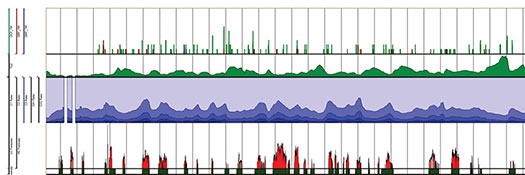
One of the first questions the engineer must answer is, what factor(s) contributed to this response? Was there something different in the rock, in the design or even in the execution of the stimulation plan? With limited data available, this is often very challenging to answer. This is where the idea originated of using drilling data to describe the rock. In horizontal wells, it is exceedingly difficult to run any type of electronic logging device, such as a sonic log or neutron density log. However, there is an abundance of information within the drilling data, itself, if you know how to interpret it, Fig. 1.
When drilling a well, a certain amount of energy is expended for each foot drilled. This energy is made up of two primary factors—first, the strength of the rock, with harder, more competent rock typically requiring more energy to drill; and second, the drilling efficiency, which is a combination of several factors, including the amount of bit wear, motor and bit selection, mud weight and more. If engineers and geoscientists can directly account for, and remove, these changes in drilling efficiency, they can then map changes in rock strength along the lateral with an extremely high level of precision.

Even though this measurement is isolated to only the rock being drilled, it is this near-wellbore property that is a key determining factor in how fractures initiate and propagate, and can often determine the ultimate success of each individual well. These data are critical in designing the optimum completion, which will ultimately affect well production.
The data are there, if you know where to look. The process of differentiating between rock strength and drilling noise is by no means an easy task. However, since 2014, significant advances in interpretation have been made. The process used is analogous to what happens when wearing a pair of noise-cancelling headphones. There is the sound you are trying to isolate (rock strength), competing with background noises (drilling efficiency). If one can correctly account for the background noises, they can be cancelled, leaving only the sound intended to be heard.
However, unlike noise-cancelling headphones, there is no microphone to identify the background noise, and thus the differentiation between drilling noise and signal is left to highly skilled experts with a custom-built kit of software tools developed specifically to help identify and filter out these changes in drilling efficiency. The data are meticulously analyzed on a foot-by-foot basis, which results in an accurate representation of the rock strength known as the RockMSE (mechanical specific energy).
How accurate is this process? It can be measured in two different ways. First, by depth accuracy. Drilling data are typically recorded at a fairly high sample frequency of one data point per second, and then converted to a depth domain. If drilling proceeds at 200 ft/hr, there will be approximately 18 measurements taken for each foot drilled, which can then be filtered, smoothed and averaged without excessive loss of resolution. In addition, unlike wireline measurements that need to compensate for stretch in the wireline, the depth reference of drilling data is highly accurate, since the exact amount of drill pipe in the wellbore is known at any given time. The second measurement of accuracy involves just how representative of rock properties this rock strength analysis is.
While the accuracy of the data is dependent on the drilling environment—and poor drilling conditions can lead to poor data accuracy—most drilling efficiency changes can be accounted for and corrected. Thus, having a robust process of identifying and correcting for multiple drilling efficiency changes will allow for accurate determination of rock properties, even in the most challenging drilling environments. Through a process of continuous improvement and development, the accuracy of the process has improved so that rock strength from drilling data can now be accurately and consistently represented and verified when compared to other diagnostic methods.
Detection of localized depletion from drilling data. It was through process improvements in 2018 that engineers started to notice anomalous residual artifacts appearing in some wells that apparently could not be explained by changes in drilling performance or larger geological features. Upon investigating what these artifacts were, it was determined that they only occurred in infill wells. Based on this development, it was quickly realized that what occurred was the result of drilling through depletion. This was validated by comparing to other diagnostic methods, such as fiber optics monitoring, microseismic data and radioactive tracer logs.
One early trial of the technique was a blind study, where an infill well was analyzed. The resistivity image log from this well is shown in Fig. 2 and outlined in the Unconventional Resources Technology Conference (URTeC) technical submission 2021-5628. In this example, there is a clear and obvious match between the location of localized depletion, as seen from drilling data, and the presence of an imaged fracture at the center of the depletion. While not all fractures had depletion associated with them, almost all areas of localized depletion had a fracture imaged across it. In addition, the analysis of the mud gas helped to enhance the understanding of the results. In Fig. 2, the second track from the bottom shows the composition of the gas extracted from the mud during drilling, with light blue being the C1 fraction and darkest blue being the C4 fraction.
It is observed that in areas of identified depletion from the drilling data, there is also a decrease in the percent of C1 gas, as well as a decrease in the total gas rate displayed on the third track from the bottom. It is believed that this is likely caused by the C1 gas molecule being more mobile than the larger C2+ gas molecules. As a result, in areas of depletion, there is a lower concentration of C1 compared to the other gases. In addition, the presence of depletion results in less gas being entrained within the rock. The total gas collected from the mud system is less than would be found in a non-depleted reservoir.
The reason localized depletion is visible in the drilling data is because reservoir pressure is a force acting to break the rock. The more force within the rock pores, the greater the rock wants to break on its own, which is one of the reasons drilling mud is used to keep the formation stable during the drilling process. Due to the lower internal forces in the depleted rock, it takes more energy to drill. It is these slight spikes in energy that give an indication of existing localized depletion in the infill well. With additional processing and interpretation, a highly accurate map of localized depleted fractures can be created along the wellbore. A comparison between these depletion maps and resistivity imaging has shown that the depletion analysis workflow averages 90% accuracy in identifying offset well fractures at the infill well location and can detect depletion levels as low as 15 to 25 psi.
With this unique understanding, the use of drilling data and its relative applications are quickly becoming a critical addition to the standard toolbox for many engineers. Localized depletion detection has had a profound impact on the treatment of infill wells. Multiple operators throughout several basins are using drilling data to identify these offset fractures and adjusting their completion designs to decrease associated risks. For example, by avoiding cluster placement near an identified depleted fracture, operators are finding that offset wells are significantly less impacted by the new completions.
Additional data from drilling provides insight to natural fracture location. While the protection of offset wells from frac hits has massive economic benefits, the data have further applications in completion design. Combining different data sets yields additional information, such as the prediction of areas along the wellbore that may contain natural fractures. An example can be seen in the Marcellus shale, which is known to have networks of natural fractures. The presence of natural fractures typically is the result of several factors, which include a high-strength (brittle) rock combined with low clay content. In a tight shale, these natural fractures also represent an enhanced flow path, so one might also expect slightly higher gas shows in the drilling mud returns.

All three of these properties can be measured from drilling data. Rock strength is obtained from RockMSE, and clay content is derived from the gamma ray log. Total gas is measured during drilling as well, but it needs significant filtering and editing to provide a reasonable proxy. If the above curves are normalized and added together, it is then possible to predict where natural fractures are most likely to occur. In the below example, a resistivity image logging tool was included in the bottomhole assembly. Figure 3 shows how well the areas with high predicted fracture probability match with the actual fractures imaged.
Near-wellbore frac fluid distribution modeling. With this new stream of data now becoming available in horizontal wells, another new development in completion design is underway. This involves modeling how the frac fluid will be distributed among the perforation clusters, using data from the near-wellbore. It has been well-documented that the rock properties at the point where a fracture initiates have a significant impact on how fractures grow.
This is amplified when considering multiple fractures propagating in a stage during a single pumping operation. These near-wellbore properties will affect frac initiation, which dictates how fluid will be distributed between individual clusters. When combining these properties with modeling of the perforation friction, stress shadows and other dynamic flow effects, these near-wellbore flow models can predict fluid distribution. This becomes increasingly useful when the model is calibrated to real data, such as perforations imaged post-treatment or when used with well fiber optics.
Calibrations are performed to identify the stress heterogeneity, the amount of stress shadowing, perforation erosion rate and more. As a result, engineers are now able to numerically calculate the optimal perforation and stage design for each reservoir. Doing this drastically reduces the time and cost of narrowing into optimal designs using the trial-and-error or “looking over the fence” methodologies that are often being used today. Operators can model changes to the completion design by adjusting common completion variables, such as the number of clusters per stage, perforation diameter and stage length. The expected effects on cluster efficiency can be reviewed prior to implementing and executing the actual completion.
Further, once a well-calibrated and accepted model is created, operators can start moving away from using off-the-shelf designs created before the well was even drilled, and completion designs can be tailored individually, based on the actual rock properties of the well. The main advantage of this type of workflow typically would be a reduction in completion costs, since off-the-shelf designs are typically designed conservatively, in order to ensure the best coverage under the most difficult reservoir conditions.
Operators reap the benefits of using existing drilling data when planning completions. The ultimate goal of any new oil and gas technology should be to improve well results with minimal cost and disruption to wellsite operations. Drill2Frac’s non-invasive process provides valuable insights on near-wellbore rock properties and flow modeling, using existing data. Information is extrapolated from data collected during the drilling process. No additional equipment, wellsite services or personnel are needed. This service can be used on mature wells when considering future best practices or on new wells to plan the most efficient completion design. In conclusion, there are several overall benefits of using drilling data to enhance completion design:
- The data already exist. There are no additional services, equipment or wellsite personnel needed.
- The process provides insight into rock properties on both new and previously drilled wells.
- The process identifies areas of localized depletion to aid in mitigation of fracture interactions.
- Stage-by-stage reservoir attributes are available to complement stage-level completion metrics for high-resolution analytics.
- Completion designs can be tailored to the actual rock being stimulated.
The combination of these benefits leads to an enhanced completion design yielding more efficient operations, which results in decreased risk of unexpected issues and fracture-driven interactions. The insights gathered from data obtained in this process allow operators to optimize their completions for improved well performance, increased efficiency and better economics.

- Simplified intelligent completion architectures improve zonal control economics (May)
- From post-mortem to real-time: A scalable approach to fracture diagnostics (May)
- The value of all-electric intelligent completions (April)
- Completions in the digital age: A true end-to-end approach (October 2025)
- The power of less: Surface pressure containment ecosystem autonomously delivers continuous sanding with fewer pump swaps (October 2025)
- A decade of excellence in the Middle East (October 2025)
- Subsea technology- Corrosion monitoring: From failure to success (February 2024)
- Applying ultra-deep LWD resistivity technology successfully in a SAGD operation (May 2019)
- Adoption of wireless intelligent completions advances (May 2019)
- Majors double down as takeaway crunch eases (April 2019)
- What’s new in well logging and formation evaluation (April 2019)
- Qualification of a 20,000-psi subsea BOP: A collaborative approach (February 2019)

