2022 Forecast: U.S. proved reserves drop sharply
According to the U.S. Energy Information Administration (EIA), the price effects of the economic slowdown following the Covid event contributed to reductions in U.S. petroleum and natural gas reserves in 2020. Proved reserves of crude oil and lease condensate decreased 9 Bbbl in 2020, a decline of 19%. Proved reserves of natural gas decreased by approximately 22 Tcf, a drop of 4.5%.
The pandemic had a significant effect on U.S reserves. On March 13, 2020, then-President Trump declared a national emergency in the U.S. Many states imposed mandatory lockdowns and issued stay-at-home orders, and in addition to travel restrictions, people also voluntarily chose not to travel, to avoid exposure. Consequently, demand fell for transportation fuels, and commodity prices fell. Liquid fuel production also faced a critical shortage of available storage, which caused WTI to plummet 300%, to minus $37.63/bbl in April 2020. As a result, operators revised their proved reserves downward in 2020 and postponed development drilling.
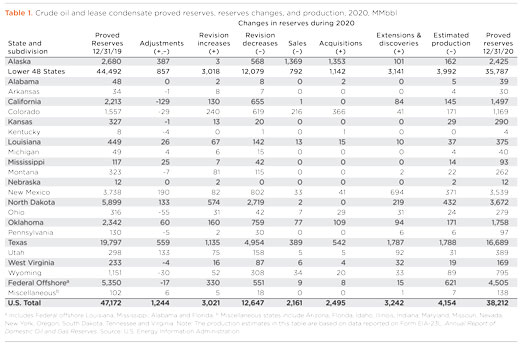
Crude oil. The precipitous decline in drilling activity caused proved reserves of U.S. crude and lease condensate to decline 19%, from 47.2 Bbbl to 38.2 Bbbl at the end of 2020, Table 1. Proved reserves of crude decreased 8.4 Bbbl in 2020 and proved reserves of lease condensate (produced from natural gas wells) decreased 560 MMbbl. U.S. oil and lease condensate production decreased 7% in 2020.
Texas, the state with the largest volume of proved reserves of oil and lease condensate, had the largest net decrease in 2020, dropping 3.1 Bbbl, a 16% decline. North Dakota had the second-largest net decrease, losing 2.2 billion barrels (-38%). And the GOM experienced the third-largest decline, slipping 0.8 Bbbl (-16%). Utah had the largest net increase in proved crude/condensate reserves in 2020, adding 91 MMbbl (31%).

Tight oil. Meanwhile, U.S. tight oil reserves fell 15.4% during 2020, to 19.7 Bbbl, with every play experiencing a loss. The largest play, the Permian basin, fell 1.6% to 11.9 Bbbl. The greatest loss occurred in the Bakken shale, where reserves fell 37% to 3.7 Bbbl.
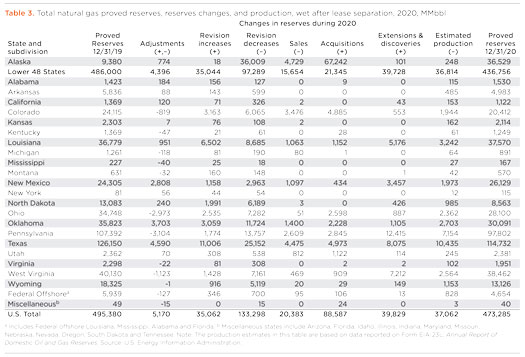
Natural gas. Proved reserves of natural gas decreased 4.5%, from 495.4 Tcf at year-end 2019 to 473.3 Tcf at year-end 2020. The decrease was the second, consecutive annual setback in proved reserves of natural gas in the U.S. However, producers in Alaska managed to add a substantial new volume of proved natural gas reserves in 2020. The annual total of proved gas reserves in Alaska increased in 2020 by 27 Tcf, quadrupling the state’s total from 9 Tcf to 36 Tcf. Producers in Texas reported the largest decrease in proved gas reserves in 2020, losing 11 Tcf, a decline of 9%. Pennsylvania experienced the second-largest decrease of proved gas reserves, dropping 9.6 Tcf, a decrease of 9%.
Proved natural gas reserves nationwide were set to decline over 10%, but on May 21, 2020, the U.S. FERC approved the large-scale Alaskan LNG Project. The Alaska LNG Project will connect gas reserves and production in the Prudhoe Bay Unit of Alaska’s North Slope with (via pipeline) liquefaction facilities on the Kenai Peninsula, allowing up to 20 MMmt/year of LNG exports. Project approval means that a large volume of previously stranded Alaskan gas resources are now “proved.” Thus, Alaska’s proved gas reserves increased in 2020 by the aforementioned 27 Tcf, boosting the state’s total to 36 Tcf. Additional production facilities will add more reserves in future years.
Proved reserves are estimated volumes of hydrocarbon resources that analysis of geologic and engineering data demonstrates with reasonable certainty are recoverable under existing economic and operating conditions. Reserve estimates change from year to year because of: 1) new discoveries; 2) appraisals of existing fields; 3) production of existing reserves; 4) changes in prices, costs, ownership or planned infrastructure; and 5) new and improved techniques and technologies.
- A Baker Hughes executive assesses the electrification effort (May)
- First Oil: OTC soldiers on for another year (May)
- OTC recognizes 2026 Spotlight on New Technology® Award winners (April)
- What's new in production: When everything is going wrong at the same time (April)
- SBM executive sees strong FPSO market on back of deepwater trend (April)
- IPAA’s annual meeting to re-visit site of association’s founding (April)
- Subsea technology- Corrosion monitoring: From failure to success (February 2024)
- Applying ultra-deep LWD resistivity technology successfully in a SAGD operation (May 2019)
- Adoption of wireless intelligent completions advances (May 2019)
- Majors double down as takeaway crunch eases (April 2019)
- What’s new in well logging and formation evaluation (April 2019)
- Qualification of a 20,000-psi subsea BOP: A collaborative approach (February 2019)

