Effectively utilizing data in production facilities
Capturing data is especially important to production facilities which rely on expensive and often bespoke machinery that requires reliable operation and efficient utilization of their supporting resources (energy and consumable components). In pursuit of achieving “Industry 4.0” production levels, companies seek to create smart production facilities. This entails moving towards a scalable and flexible solution using digital capabilities such as data analytics and machine learning.
Production processes generate substantial amounts of data that could be gathered and analyzed in real-time to improve process optimization and facilitate timely business decisions. While most production facilities use sampling methods for quality control of production batches, analyzing data from a batch process could be labor-intensive and costly.
Harnessing flow meter data. While the oil and gas sector enhances process control and safety, it also generates a deluge of complex data structures that engineers cannot manage and interpret quickly enough to avoid an unplanned event such as flow meter downtime. Production downtime adversely impacts productivity, leading to an overall reduction in business profits due to the reduction in units being produced and sold. To minimize the loss of assets, petroleum enterprises need to reduce downtime, optimize operations and enhance maintenance strategies.
Data-driven modelling. To interpret the vast amounts of data, data-driven models can utilize this information and deliver analytics solutions to allow businesses to reduce unplanned events. Data-driven solutions explore the impact of varying parameters in equipment or even more device-specific digital diagnostic values on specific industrial conditions.
In the upstream sector of the oil and gas industry, computer models are broadly used for field development, operational decision-making, and further investments in oil fields. Also, unforeseen downtimes caused by faults and breakdowns can cause an overwhelmingly heavy loss of assets and business failure for companies. Therefore, regular maintenance as well as health and viability monitoring of machinery is a standard procedure in industrial sectors.
The primary objective behind utilizing data science techniques is to give end-users access to an informative diagnostic interpretation of process values commonly found in the field. This will enable faster decision-making and cost reduction for facility operation. For instance, a data set containing experimental results and diagnostic conditions can be learned from to help understand individual device performance drift as well as overall facility performance and critical equipment failures. Building a model with high predictive capability for this historical data will generalize our prediction towards unseen conditions (i.e. extrapolation) in the future. Consequently, the data-driven model will predict a set of conditions that are likely to cause failure in the system under study. A reliable predictive model can quantify the error associated with an unseen set of diagnostic parameters where running physical experiments in the laboratory are too tedious or costly.
In the process of data-driven modelling, a data pipeline is used to collect, preserve, access and transform raw data to take advantage of the value they can deliver, Fig. 1.
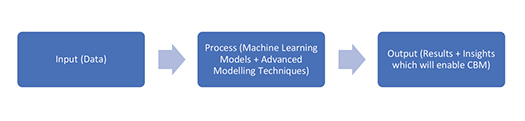
The goal of machine learning is simple: make faster and more predictive decisions. If the predictive model is robust (i.e. highly generalizable), then the likely conditions of failure/error predicted by the model will deter the need for conducting further experimentation and data gathering at a potentially high financial cost. These conditions may be indicative of a known fault or an unknown event. The models will extract this information to predict the future state of a system based on live and historical data. This process is known as Condition-Based Monitoring (CBM).
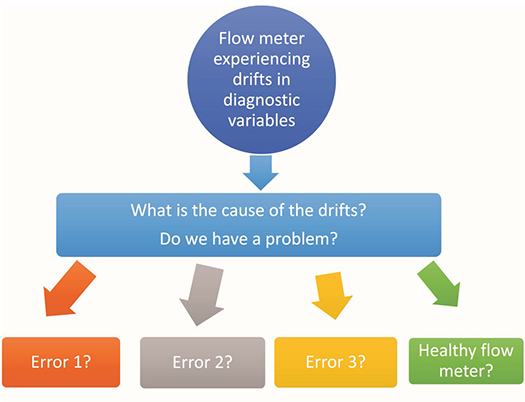
CBM is the process of observing varying parameters in equipment such as temperature, pressure, or even more device-specific digital diagnostic values, which may be correlated to specific industrial conditions. These conditions may be indicative of a known fault or an unknown condition, Fig. 2. The time associated with failure diagnosis during scheduled maintenance is also minimized as a digital network allows for remote examination.
Consequently, CBM allows old machines and infrastructures to be operational for a longer period which, in turn, leads to the extension of Remaining Useful Life (RUL). CBM has the potential to reduce operating costs by enabling dynamic facility operating patterns based on real-time meter performance and diagnostic values. Moreover, with enough historical information on a specific device, it is possible to predict calibration errors over time within a cognitive predictive domain.
Furthermore, while the goal of a CBM tool is to use real-time indicators to evaluate the status of an asset, it is often difficult to find one that is suitable for a particular system, as a one-size-fits-all approach may not necessarily work for most organizations. Some CBMs available in the market are best suited for a single machine, while others only help provide a holistic view of the system. It is therefore important to first analyze the system requirements and operating environment to determine the best CBM tool.
To perform a reliable data-driven modelling, high-quality input data is needed. This requires end-users to have a well-maintained and structured data system and a better understanding of the intricacies that lie within the data. Input from industry experts is also needed to account for human experience in specific scenarios to optimize the information that can be extracted and realize the true impact of data modelling techniques for the industry. Consequently, to better understand the requirements and specifications of end-users from different industries, TÜV SÜD National Engineering Laboratory has conducted surveys as well as engaged with clients in webinars, conferences and commercial projects to construct a user requirements specification (URS) on CBM and users’ expectations and requirements.
IDENTIFYING CHALLENGES
One of the main challenges observed by TÜV SÜD concerning the data they have worked with across multiple projects is the lack of standardization in the data format/structure as well as in the labelling of variables and events.
The structure of the data and the labelling of variables varies between end-users. Some industries are manually entering variable names and data input, which could cause various inconsistency issues and increase the risk of human-induced bias. Other end-users are using a more reliable and efficient automated approach. The lack of standardization in the data structure increases the data processing time and labor costs to perform the necessary data cleaning and preparation before carrying out any form of data modelling. Some common data issues which can severely impact the accuracy and reliability of the CBM outputs are:
- A lack of or inconsistency in events labelling—this will directly affect the type of machine learning model that can be applied.
- Missing values/missing observations—some models cannot handle missing values.
- Symbols/words in numeric cells (e.g. NA, /, etc).
- Repeated or duplicated entries.
- Redundant values—these will not add meaningful input to the data.
If data can be stored and recorded using a standardized approach, end-users can benefit from a more efficient and automated data analyzing system, whereby valuable insights can be returned to end-users promptly. Any modelling involving live data is more complex as it would require real-time streaming and monitoring of the data and any changes in its directories. Subsequently, this would require a more robust data pipeline to overcome common issues such as data leakage and loss of signals. Modelling live data also has more requirements about the data infrastructure and so it is not always possible for live data modelling to take place.
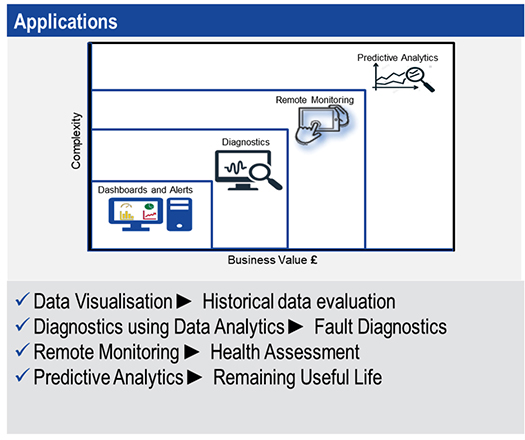
Some industries at present simply have staff monitoring data dashboards as the live data comes in, with visual inspections carried out on the trends in the data in an attempt to identify any unexpected spikes and anomalies, Fig. 3. End-users typically prefer this instant form of feedback in data analysis. However, when the review process is considered objectively concerning the potential for human error, the level of insight which can be obtained from this approach is minimal, compared to the potential data patterns and subtle correlations which can only be detected by machine learning driven CBM systems.
To address CBM in real-world scenarios, we ran different experiments in our facilities. In one recent study, two identical Coriolis flow meters were exposed to various fault conditions. After a baselining calibration exercise, both meters were systematically exposed to fault conditions by intentionally installing them with a misalignment, inducing cavitation and operating at flow rates beyond the meter's full specification. During these experiments, uninterrupted time-series data sets were generated, which included both facility reference instrumentation and digital meter diagnostic variables. Different classification models were then employed to learn facility and diagnostic variables to predict system conditions. The resulting models from this research performed considerably well in out-of-sample test predictions for real-world scenarios and could offer tangible benefits to end-users.
The accuracy and versatility of the models can ultimately be improved by feeding them additional data that covers further scenarios likely to be encountered by flow meters in the field. The resulting data will be analyzed and used to train the model to report meter performance issues in multiphase flow conditions. In addition, the facility will be used to recreate the conditions tested in previous experiments to observe and validate the model's transferability concerning its reliability while in use in a new facility.
VALUE POTENTIAL
Using standard instrumentation and diagnostic measurements, available to all end-users, combined with the support of experienced flow practitioners and meter manufacturers, can enhance the predictive power of CBM models. The predictive model can be tuned to reliably predict and highlight undesirable operating conditions specific to a given installation in a manner that non-data science experts easily understand. This also includes anomaly detection or highlighting potential problems in the system before equipment is damaged.
With condition-based calibration and predictive maintenance, oil and gas firms will adopt a more proactive approach to maintenance, meaning that facility downtime due to component failure will be reduced, and performance deterioration will be detected before the point of failure. Furthermore, a self-maintaining autonomous system will significantly reduce the ongoing costs of providing traceability to the oil and gas business. WO


