Global offshore wind capacity achieves record growth
Offshore wind continues to play a vital role in the global Energy Transition. It was another record breaking year in 2021 for the offshore wind industry, with record start-ups (84 farms, 18.5 GW, 3,400 turbines) increasing global active capacity 58% to an all- time high of 50.5 GW, Fig. 1. This takes offshore wind to approximately 0.3% of total global energy supply: our energy transition modeling suggests this could reach 6% to 9% by 2050 and generate 4,870 TWh to 5,990 TWh of power.
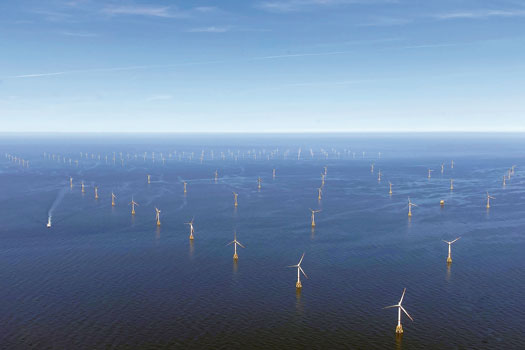
China led the way for new capacity additions and overtook the UK as the largest offshore wind market. The country has 16 GW coming online, mostly in the final two months of 2022, ahead of the expiration of a government subsidy deadline at the end of the year. New capacity additions were more modest in Europe, as 1.8 GW were fully commissioned, with 17 GW currently under development in the region.
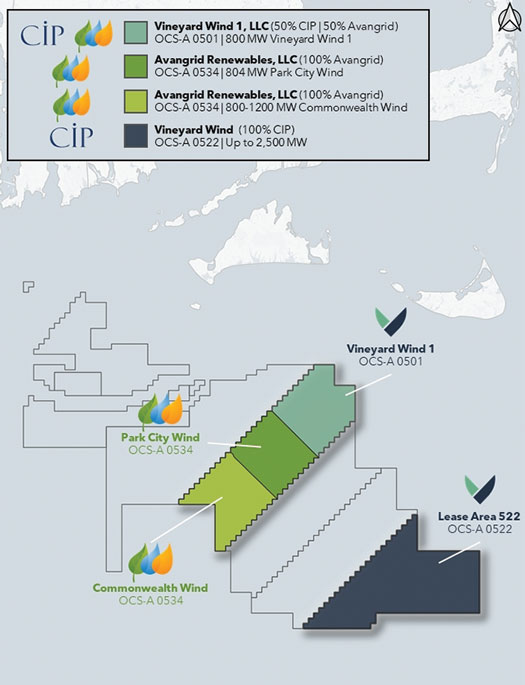
Offshore wind project CAPEX commitments reached $44.6 billion in 2021 (the second-highest total on record), with a number of significant projects reaching FID. These include the first utility-scale offshore wind project in the U.S. (Vineyard Wind, 806 MW, Fig. 2). In Europe alone, $18.7 billion of project CAPEX were committed to offshore wind projects (compared to the $10.3 billion committed to offshore oil and gas projects).
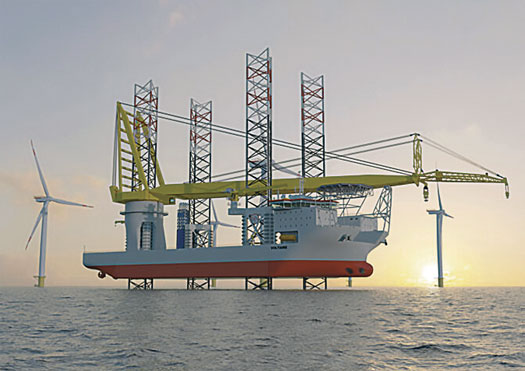
The crown jewel in European projects is Dogger Bank Wind Farm. It is an offshore wind farm being developed in three phases–Dogger Bank A, B and C–located between 130 km and 190 km from the North East coast of England at their nearest points, Fig. 3. Collectively, these phases will become the world’s largest offshore wind farm. Each phase will have an installed generation capacity of 1.2 GW and represents a multi-billion pound investment. Combined, they will have an installed capacity of 3.6 GW and will be capable of powering up to 6 million homes.
The “wind” vessel market continued to evolve, reaching nearly 1,100 vessels by year’s end. Global wind turbine installation vessel (WTIV) utilization averaged 83% during 2021 (up 6 percentage points y-o-y), while exceptional demand for vessels off China consistently kept utilization over 90% in the second half of the year. Rates responded, with the average dayrate assessment for third-generation WTIVs in Europe up 18% across the year, in addition to increases in the commissioning/service operation vessel (C/SOV) market. Dayrates reportedly quadrupled off Guangdong in China during the middle of the year.
Record newbuild investment developed during 2021, with over $4 billion of orders placed and increasing focus on alternative fuels and Energy Saving Technologies (ESTs). This included over 17 (plus 9 options) WTIV newbuild contracts placed (totaling ~$2.5 billion), the highest yearly total on record, while 15 C/SOVs were ordered (totaling ~$800 million), also the highest number on record, plus 39 CTV contracts placed.
Both OEMs and wind farm developers came under pressure from rising material costs in 2021. Chinese steel prices averaged $827/tonne during the year (up 47% y-o-y), while annual average copper prices increased 51% to $9,317/tonne. Lower-than-average wind speeds in much of Europe also limited power output from offshore wind farms, reducing the volumes that operators could sell into the market. Offshore wind farms in Germany generated 23.5 TWh of power in 2021, compared to 26.9 TWh in 2020.
Power prices in Europe surged in 2021, due to a tightness of gas supplies and lower average wind speeds. Day-ahead electricity prices averaged €97.75/MWh in Germany in 2021 (more than triple their level in 2020) and €103.55/MWh in the Netherlands (up 236%, y-o-y).
During 2022, we are projecting a healthy 9.5 GW of offshore wind capacity will come online (involving 1,400 turbines), bringing the fully commissioned global total to 60.0 GW. Offshore wind CAPEX commitments are expected to total some $55 billion, just below the record of $56 billion in 2020.
Our longer-term projections suggest that the global offshore wind sector may reach 712 farms involving over 29,000 turbines and 235 GW by 2030 (current capacity: 250 farms, 10,800 turbines, 50.5 GW).
FLOATING OFFSHORE WIND
Within the overall offshore wind market are floating offshore wind installations and projects. While “floating wind” is only a small part of the offshore wind industry today (only 10 projects of 124 MW are active, with a further 8 projects of 165 MW under construction), strong growth is expected from the middle of the 2020s as the sector reaches commercialization. Our projections suggest that 96 farms, 14.5 GW and 1,300 turbines could be active by 2030.
Floating wind is likely to open up new regional markets, where development has, so far, been unfeasible. Countries with significant numbers of floating wind projects already proposed include the UK (31.1 GW), Australia (13.8 GW) and the U.S. (10.7 GW). Over 150 floating offshore wind projects (totaling over 100 GW) have been mooted by developers in 21 countries/regions, with 37 having nameplate capacities >1 GW.
As the floating sector moves toward commercialization, the industry has proposed a variety of foundation designs (at least 12). Semi-sub foundations are the most common design in projects proposed (over 1,200 mooted, compared to the combined ~350 across spar, barge and TLP turbine solutions).
Floating wind poses new installation challenges for developers, and our analysis has examined which contractors and yards have already been active in the sector. We’ve also looked at the demands on the installation and support fleet, port infrastructure and the unique maintenance requirements of floating wind farms.
Leading developers of floating wind to date include Equinor (2 farms, 32 MW active, with 1 farm / 88 MW under development); Cobra (2 farms, 50 MW active); Ocean Winds (1 farm, 30 MW active); and Windplus (1 farm, 25 MW active). In terms of potential capacity, leading developers include BlueFloat (8.5 GW); Hexicon (7.7 GW); Oceanex (7.4 GW); Aqua Ventus (5.1 GW); and Scottish Power (5.0 GW). Contractors involved in turbine installation to date have included DOF Subsea (11 turbines under development); Saipem (5 turbines installed); Bourbon (5) and Boskalis (5).
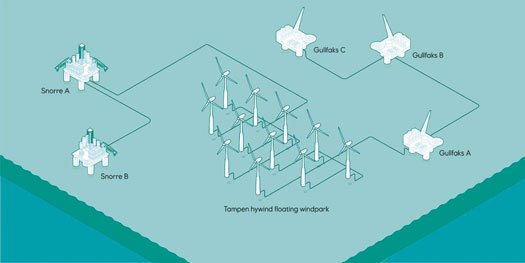
Equinor is developing the first floating offshore wind farm, Hywind Tampen, to supply renewable power to oil and gas installations in Norway, Fig. 4. The Snorre and Gullfaks oil and gas platforms will be the first ever powered by a floating offshore wind farm.
The broader offshore wind industry continues its exciting growth phase. Our long-term scenarios suggest offshore wind will play a vital role in energy transition and may provide between 6% and 9% of global energy supply by 2050. Data as of February 2022: for updates contact Clarksons.
- Tethered BOP technology enables DP rigs to drill in shallow water (June)
- Multiphase surface pump boosts revenue for Pemex while reducing costs and environmental impact (June)
- Late-life field management: Repair, repurposing and obsolescence management support sustainable well integrity (June)
- Enhancing Lower Tertiary recovery and profitability: The options – Part 2 (May)
- Nova Scotia’s Premier aims to revive province’s oil and gas activity (May)
- First Oil: OTC soldiers on for another year (May)
- Subsea technology- Corrosion monitoring: From failure to success (February 2024)
- Applying ultra-deep LWD resistivity technology successfully in a SAGD operation (May 2019)
- Adoption of wireless intelligent completions advances (May 2019)
- Majors double down as takeaway crunch eases (April 2019)
- What’s new in well logging and formation evaluation (April 2019)
- Qualification of a 20,000-psi subsea BOP: A collaborative approach (February 2019)

