What's new in exploration
I note the world is grasping that exploration is not just a lost art of the geo-endowed, but a requirement to keep supplying liquid energy until rescued by $10/gal alternatives. I applaud AAPG and SEG organizers, who conducted two panel discussions at OTC 2018 on exploration priorities, encouraging audience participation.
During the beginning of this century, millions of miles of 2D seismic data went into dumpsters thinking there was no remaining value. A very few hired contractors to put $6/mi data into digital libraries. A whole country’s worth could fit on a single CD. That data today would be useful for shale and low-frequency inversion, the forefront seismic tool for fluids.
However, traditional remote sensing tool sets remain poor in evaluating conventional reservoirs and nearly blind for unconventional reservoirs. Shale plays have been controversial from the beginning, when management said “no way.” At shale conferences, early engineers expressed that break-even was above $60 and closer to $80. Few listened while the nation’s largest land grab exploded.
Oil prices fell, shut-ins everywhere, stacked rigs worth less than salvage metal. Shale plays fell, such as Patagonia, and others sold out to someone else, i.e. Eagle Ford. What did we learn?
Blinding uncertainty. Shale blinded the industry from developing comprehensive tools needed to sustain evaluation, bleeding funds from ROZ and EOR of conventional reservoirs. Today, it is generally recognized that fractured shale from a lot of horizontal volume produces from less than 20% of those fracs. Literature commonly discusses that most oil was left behind, regardless of reservoir type. Oil and gas are still in the ground, where some cap investment may still exist.
I have expounded on the limits of petrophysical and geophysical approaches to defining rocks. I now see an open discussion among the engineering fraternity that their tool set needs help in predicting recovery from both conventional and unconventional reservoirs. This surely has been impacting SEC 10-Ks, PUDs and borrowing. Uncertainty is a big deal on predicting break-even and ROI.
Permian: Why rocks matter: How traditional mapping methods have failed to predict production trends in the Midland basin; an SPE luncheon held May 15 in Houston, with Mark Sooby, speaker, managing director at Deutsche Bank:
“Pay maps have long been the starting point for industry geologists when evaluating…conventional reservoirs, however, as the industry has moved to focus more on unconventional reservoirs, it has become clear that the traditional net pay mapping using log cutoffs leaves a lot left to be desired…Midland basin with net pay maps based on porosity, density and gamma ray cutoffs, and you see one similarity, little to no correlation…traditional net pay maps focus on rock properties that are not the primary driver for successful wells. In fact, the rock facies are vitally important. Petrophysical multi-mineral models have broken down these seemingly homogenous black rocks into highly detailed facies, making it possible to tease out the shales that are going to produce the best…” Reminding us of company risk in relying on SEC10-K numbers. I quote a communication from one of our readers, a 40-year O&G veteran, “I was always told two things: The independents do the discovering and the majors do the development, and, if you are replacing your reserves, you are going to end up for sale.” -Don Kesterson, Petroleum Geologist.
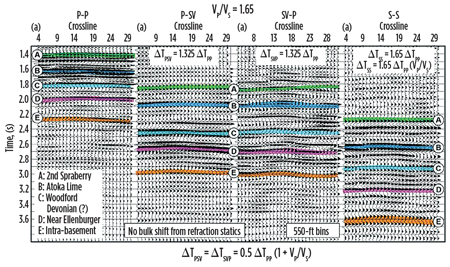
A really big deal! New approaches with seismic have seen similar difficulties when applying foundation seismic tech to shale plays. Below (Fig. 1) are modern multi-wave seismic data taken over the same xy’s, but using varying energy sources and surface geometries. I challenge any reader but Bob Hardage (author) to interpret the example for the “sweet spot” in sand or shale development, with or without the color added. This is a Midland basin example in the Wolfberry. That should be enough to tell you that you’re in trouble, since there is no Wolfberry. That word is geo-slang for Wolfcamp and Spraberry reservoirs. See “Seismic Research in Imaging Unconventional Reservoirs,” Bob A. Hardage, Exploration Geophysics Laboratory, Bureau of Economic Geology, The University of Texas at Austin (https://csegrecorder.com/articles/view/seismic-research-in-imaging-unconventional-reservoirs)
The good ol’ days are now, at least there are problem-solvers who can innovate solutions and interpret methods for real-world drilling decisions. ![]()

