Leveraging survey design and de-blending in processing provides tailor-made seismic
New technology often comes with an increased price tag. Research and design costs; marketing costs; upgrades to manufacturing infrastructure; and the overall hype surrounding a new product entering the market; ultimately translates into a price uplift for end-users. Improved data quality, along with increased safety and efficiency, can sometimes justify the extra costs.
However, during a downturn, these price premiums cannot be sustained by the market, forcing operators and service providers to become more creative with technology that is already available, to achieve project objectives. What is interesting here is that operational, data quality, and HSE risk are all minimized, when market available technologies are used, since they tend to be tried and tested, and have well-understood operational envelopes.
Optimizing readily available technology through sensible integration, as opposed to inventing new products in a tough market, is not a bad thing for technological progress. Some argue that this, in itself, is the cycle of innovation, responding to market force and operational needs.
XArray is one such example of innovation, through harmonious integration of currently available technologies, in the marine towed-streamer seismic space, providing tailored solutions to meet project objectives. The result is increased efficiency of up to 50%, significant improvement in data quality, and more flexibility in survey design and planning. Since it uses technology that is already available and deployed in the fleet, it comes with no additional capital outlay, HSE exposure, or cost uplift to clients.
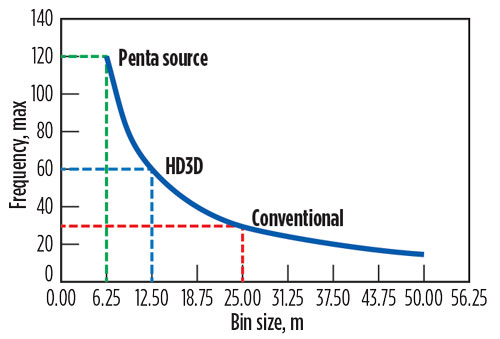
The improved efficiency and data quality derive from leveraging dense shot-point intervals, and multiple sources, to improve in-line and cross-line sampling. In towed-streamer configurations, in-line sampling is calculated by halving the distance between receiver groups on the streamer. The industry standard streamer receiver group intervals of 12.5 m achieves an in-line bin dimension of 6.25 m.
Cross-line sampling, on the other hand, is the result of the streamer interval divided by twice the number of sources used. In the case of dual-source acquisition, the cross-line bin dimension is one-quarter the streamer interval. In the XArray case, cross-line sampling is one-sixth and one-tenth of the streamer interval for Triple-source and Penta Source configurations respectively, a considerable reduction in cross-line bin size, and increase in cross-line CMP samples while using the same amount of in-sea equipment.
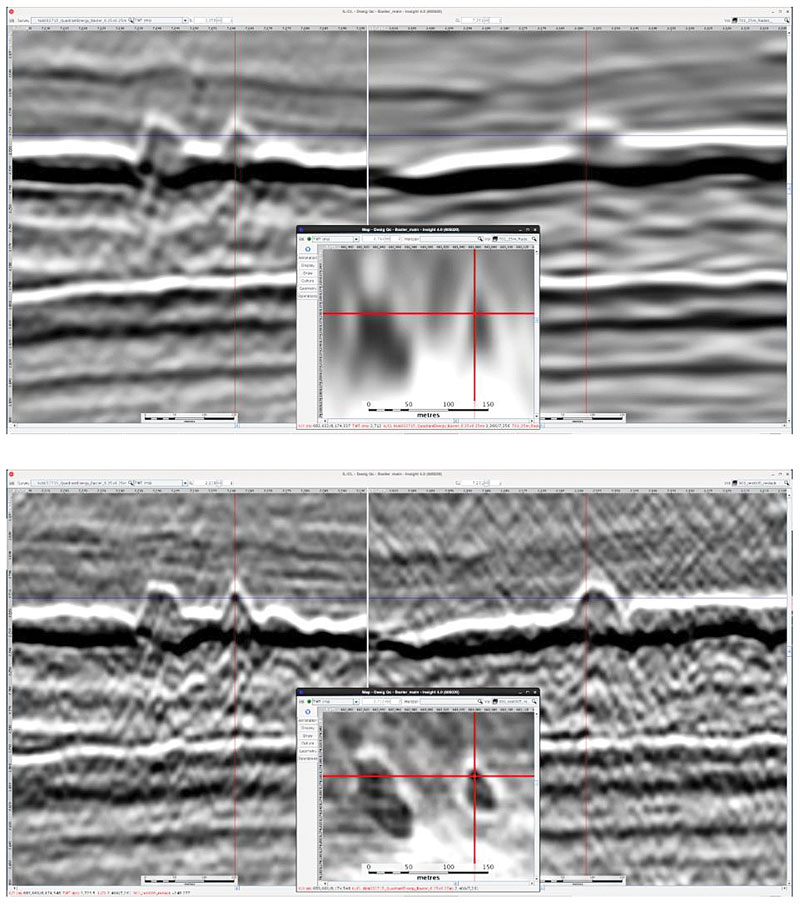
The direct impact on the data quality is that the maximum un-aliased frequency recorded in the field, as shown in Fig. 1, is boosted with the corresponding improvement in image quality. Diffraction tails at fault terminations are captured and contribute to the final image, as do steeply dipping horizons and fine stratigraphic details. Fig. 2 shows slices from the Baxter 3D survey, acquired for Quadrant Energy offshore Australia.2 The survey was acquired with a Penta Source configuration to achieve 6.25-m x 6.25-m bin dimensions. A portion of the survey was reacquired, using conventional dual-source acquisition with 6.25-m x 25-m bin dimensions, to allow for a direct comparison between the two geometries. As demonstrated in the sections (above), there is significant uplift in resolution, as might be expected with the tighter bin dimensions of the XArray Penta Source acquisition.
Several benefits become evident on the processing side. These range from the resolution uplift achieved with square bins at 6.25 x 6.25 (in the case of Penta Source), to capturing the effects of surface ghost attenuation (broadband) in the cross-line direction and improved multiple attenuation, due to increased trace density. However, the most obvious benefit is operational, in that the survey heading no longer needs to be defined by the predominant direction of structural dip, to ensure apparent dips in the cross-line direction are small enough to avoid aliasing.
The survey direction can be chosen, based on the most optimum line heading for the survey geometry, or in response to operational restrictions, such as shallow-water areas or maritime boundaries. We have seen several cases, where the survey economics are drastically improved, sometimes making the difference between a viable survey and not shooting at all.
In cases where conventional cross-line sampling is sufficient to achieve project objectives, XArray can be used to improve survey efficiency. Using the example of 25-m cross-line bin size, achieved using 12 streamers, the dual-source case uses 100-m separation between streamers, vs. 150 m in the case of triple-source. This results in a 30% reduction in the number of vessel sail-lines (and associated savings in time and cost). This is particularly useful when paired with the ultra-wide spreads possible with today’s deflector and drag reduction technology.
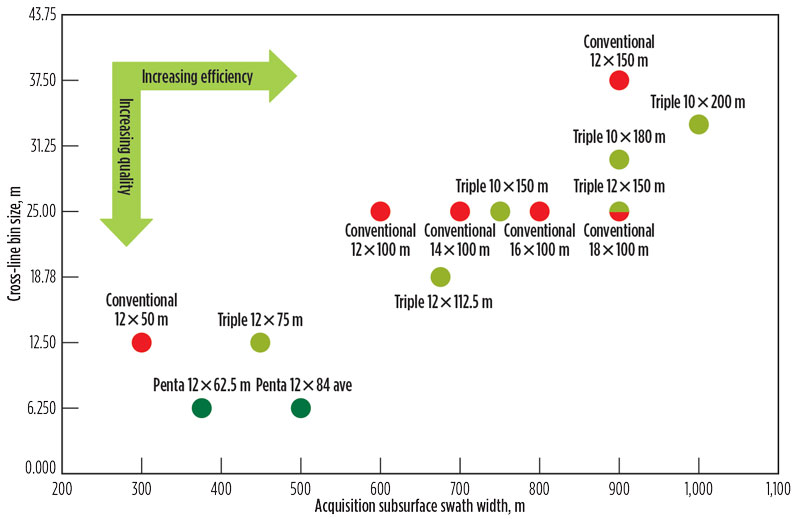
Polarcus recently towed a 10-m x 200-m spread in Myanmar. With a dual-source setup, this spread achieves 50-m cross-line sampling interval compared to 33 m with triple-source for the same streamer spread. A viable alternative that also has been achieved in the industry is 18 m x 100 m with dual-source; however, this comes with a considerable increase in HSE exposure and capital outlay, due to the amount of in-sea equipment required, the size of vessel required to host the additional inventory, and the cost to operate such a platform.
The triple-source equivalent would be 12 m x 150 m, which is no different in terms of the in-sea equipment that forms the industry favorite 12-m x 100-m, and with the same level of sampling achieved. Fig. 3 compares efficiency and data quality for commonly used dual-, triple- and Penta-Source configurations. This is by no means an exhaustive list, but it serves to illustrate the efficiency and data quality gains of using additional sources in acquisition.
Admittedly, the idea of using multiple sources is not new, but the ability to acquire and process dense shot-point data is what makes it viable today. In an effort to boost efficiency, streamer spreads have grown steadily since the late 1980s, often referred to as the “streamer arms race.” Prior to that, it was sources that were considered the means by which subsurface sampling and coverage per vessel pass (efficiency) could be increased.
Single-source, single-streamer configurations gave way to multi-source configurations, in an effort to double and triple sail line coverage per vessel pass. The main hurdle to further expansion, however, was the reduction in in-line fold, and the inadequate offset and mid-point sampling that resulted. This was as a direct result of the coupling of shot-point interval and record length, in the absence of continuous recording technology, and a means of removing overlapping source energy in processing. Record lengths were referred to as being source initiation-constrained, and shot-point intervals were dictated by the record length required to capture reflection form survey geologic targets.
In the recording system, enough time between shots, to record the chosen length of record plus the instrument overhead time, was required or shots would be missed, resulting in holes in coverage. Thus, record-length shot-point pairs of 9 s – 25 m, 13 s – 31.25 m, 7 s – 18.75 m became standard. Areas where there were shallow targets, requiring denser shot-point intervals, as well as deeper targets requiring a longer record length, would likely need more than one survey to be imaged properly.
The same challenges apply to multiple-source acquisition. The record length required to capture targets of interest was too long to allow for frequent enough firing of the sources. Thus, the subsurface line shot-point interval would provide insufficient fold or spatial sampling to support pre-processing of offset and mid-point gathers. For example, triple-source acquisition with a 25-m shot-point interval would result in 75 m between consecutive shots from the same source, 75 m between traces in a common trace gather, and 150 m between traces in a CMP gather.
The advent of continuous recording removed the interdependence between record length and shot-point interval. A record length of 13 sec could be paired with a shot-point interval of 18.75 m, for example. It gave the flexibility needed in the field to keep shooting in the presence of variable currents. More importantly, there was now no “dead time” between shot records, and arbitrary record lengths could be created, after the fact, in processing. This partly solved the issue of subsurface line spatial sampling on common trace and CMP gathers, however the issue of overlapping shot energy persisted.
It would be addressed with de-blending in processing. Energy from subsequent shots could be attenuated effectively, revealing deeper reflections beneath. Admittedly, de-blending is the most cutting edge of all the elements of XArray. Although the technology has featured in the industry in various flavors over the last ten years, and the general consensus seems to be that it will be an integral part of how seismic surveys are acquired moving forward, its adoption has only started to accelerate in the last three years.
While the technology, itself, has progressed considerably, it is useful to understand how mitigation of any perceived risk is built into XArray to provide an added layer of comfort. In many simultaneous source acquisition systems, arrays are fired within close temporal succession, typically less than a second, with an instrument-induced dither applied to aid separation in processing. The technology uses what is more accurately referred to as “near-simultaneous shooting,” where shots are fired in distance mode according to a dense pre-plot of regularly spaced shot-points.1
Although shot locations are regularly spaced in distance, there is a natural randomization in shot times that results from the variation in time that it takes the vessels to travel from one shot-point to the next. This natural randomization of firing time is exploited to allow for effective separation in the de-blending process. Fig. 4 shows an offset gather difference plot after de-blending, with the overlapping energy randomized as a result of natural variation in shot-to-shot firing time.
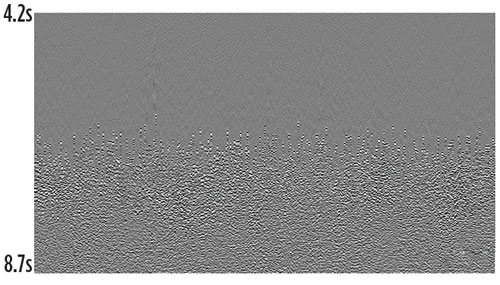
During the de-blending process, several consecutive shots are concatenated to form super records. This randomization of all shot-generated energy that does not correspond to the array in question is removed in offset and mid-point domains. It is also interesting to note that shot-generated energy includes direct arrivals, reflections, refractions, diffractions, multiples and any other shot-generated noise.
The regularly spaced pre-plot, resulting in some amount of time between shots, is a key part of XArray. The duration of time between shots, often referred to as the unblended zone, is controlled by the shot-point interval and survey currents, and is used to ensure high-priority targets are protected from interference during the survey design process. What is also interesting is that there is no loss in shot density, due to overlapping shots compared to simultaneous shooting, as the time required for air guns to recharge is the same in both techniques, and results in the same average trace density for both. Another difference is that overlapping shots provide more spatial separation of individual shot locations, which can be helpful for multi-channel noise attenuation techniques like SRME.
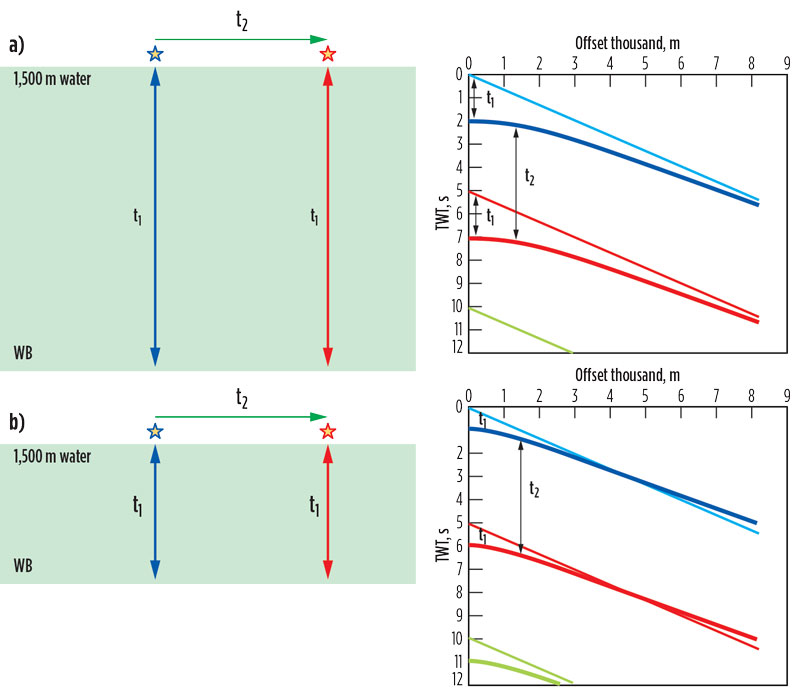
When considering the relationship between the shot-point interval and the degree of overlap, the overlap should not be considered in an absolute sense, i.e. relative to time zero. Instead, it is described more accurately as the time between consecutive water bottom reflections, as the de-blending process works on the overlapping reflection data to reveal the primary reflections. What this means is that it is independent of water depth, but it is equal to the time between consecutive shots.
Considering the most common triple-source shot-point interval of 12.5 m, there is 5.4 sec between shots, at a nominal vessel speed of 4.5 knots, and the interfering reflection train arrives 5.4 sec after the primary water bottom reflection on the shot record. The large majority of surveys have the primary target within the first 5 sec below the water bottom, but the shot-point interval can be adjusted either way, depending on the objectives of the survey design and the desired degree of overlap.
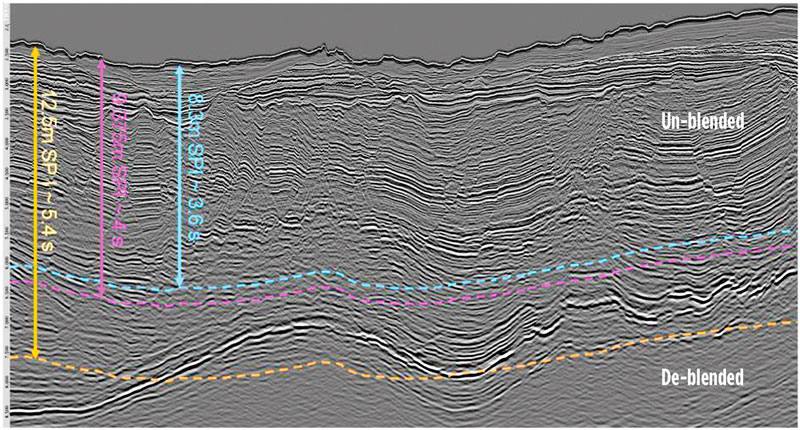
Figures 5 and 6 show the relationship between shot-point interval, water depth and degree of overlap. What is also apparent in Fig. 6 is the effectiveness of the de-blending process, as there are no noticeable indications of where the overlap energy existed prior to de-blending.
Combining the use of continuous recording, dense in-line shot-point intervals and multiple sources, Polarcus has leveraged survey design and de-blending in processing to provide tailor-made seismic solutions, under the banner of XArray, to meet the client’s project objectives. The component technologies are well-accepted in the industry and utilize equipment currently available onboard our vessels, and familiar to our crews. The flexibility gained by this method allows for reduced turnaround time from first shot-point to drilling, reduced HSE exposure, and improved data quality. Polarcus has acquired over 40,000 km2 of dense shot-point and XArray data to date, and there remains growing interest in applying this method in basins around the world. ![]()
REFERENCES
1. Berkhout, A. J. (Guus), Gerrit Blacquière and Eric Verschuur, “From simultaneous shooting to blended acquisition,” SEG Technical Program Expanded Abstracts, 2008.
2. Hager, Ed, Robert Kneale, Laurence Hansen, and Troy Thompson, “Baxter: A high-resolution, penta-source, marine 3D seismic acquisition. SEG Technical Program Expanded Abstracts, 2016.

