53rd ReedHycalog Rig Census
Record number of newbuilds joins the rig fleet
High commodity prices have brought increases in most rig fleet categories and regions. Many new units and previously idle rigs have gone to work in the last year.
Steve Berkman and Tory Stokes, ReedHycalog, Houston
 The anticipated debut of newly manufactured units has begun. This increased capacity is the primary factor impacting this year’s dynamic US rig fleet, according to the 53rd annual ReedHycalog Rig Census. The numbers of available rigs in the US, Canada, global offshore mobile, and international land rig markets all rose this year. Strong commodity pricing helped to put these new units and many previously idle rigs to work, and fleet utilization rose in most markets. The anticipated debut of newly manufactured units has begun. This increased capacity is the primary factor impacting this year’s dynamic US rig fleet, according to the 53rd annual ReedHycalog Rig Census. The numbers of available rigs in the US, Canada, global offshore mobile, and international land rig markets all rose this year. Strong commodity pricing helped to put these new units and many previously idle rigs to work, and fleet utilization rose in most markets.
ReedHycalog continues to work closely with RigData to compile the US census, Nickle’s Rig Locator to monitor Canadian activity, and ODS-Petrodata to summarize the global offshore mobile rig fleet. The international land rig fleet will also be examined for the second year, as we expand our scope and refine our methodology to get a better picture of the global rig market.
CENSUS STATISTICAL HIGHLIGHTS
Several key statistics from this year’s census include the following:
- The US rig fleet had a net gain of 272 rigs this year, expanding to 2,298 units from 2,026. This net increase is the result of 391 rig additions and 119 deletions during the past year, Fig. 1.
- The largest gain to the US fleet, 238 units, was due to rigs that were newly manufactured.
- The total number of US rigs meeting the census definition of “active” was 2,200, versus 1,920 last year, an increase of 15%.
- US rig utilization rose another percentage point to 96% from 95% in 2005, Fig. 2.
- The total number of US rig owners increased by 31 this year to 257, as more companies found it economically viable to enter the market.
- The Canadian rig fleet reached a new record high, up to 799 units from 741. This includes an additional 63 newly manufactured rigs that were added to the fleet.
- Canadian utilization climbed 10 percentage points to 84% during the spring census period.
- The global offshore mobile fleet rose by a net 13 units to 654. This takes into account gains from reactivations and brand new units, as well as losses due to hurricane damage and retired units.
- Global offshore mobile utilization remained at 85%.
- Outside the US and Canada, utilization in 2006 was up significantly to 95% for land rigs, an increase from 83% last year.
 |
 |
RIG AVAILABILITY: US RIG BUILDING EXPANDS THE FLEET
During the past few years, record oil and gas prices have spurred rig owners to mobilize additional units. Not only has the market upswing encouraged contractors to reactivate or refurbish their inventory of older units, but rig building programs have also been established and are now coming to fruition. With the assistance of RigData, census takers reported that the US fleet gained 391 rigs in 2006, due to improved market conditions, up from 211 units added in 2005. These 391 rigs that were added more than offset fleet reductions. Fleet additions fall into one of four categories, Table 1:
- Newly manufactured rigs
- Rigs brought back into service after being inactive
- Rigs assembled from parts
- Rigs moved into the country
 |
| TABLE 1 |
|
Changes in the available US fleet
Click image for enlarged view |
|
|
Most of this year’s gain has come from rig construction programs that continue to add rigs to the market. Not only has needed capacity finally been expanded, but the aging fleet is also being revitalized by this influx of newbuilds. As of the spring census period, a sizable number, 238 rigs, were tallied to have entered over the past year, with even more anticipated in the coming months. Taking into account new rigs, alone, would have caused the fleet to rise 12% during the past year. This is an especially significant increase, because just 136 newbuilds were added during the entire past decade. Of the 238 new units added this year, owners reported building 235 new land rigs, two platform units and one barge rig.
The number of US rigs brought back into service dropped somewhat this year, to 95 units versus 124 reactivated in 2005. Each of these units had been accounted for in previous years, but they were subsequently removed, due to becoming inactive or inoperable. In this tight market, customers are now paying rig owners to refurbish and upgrade their older equipment.
Units assembled from component parts numbered 53 this year, down slightly from 58 rigs built from parts in 2005. The volume of idle equipment useful for reconditioning has declined somewhat over the past few years, and newly manufactured units are finally taking their place.
This year’s census counted five rigs that were brought into the US from other countries. This compares with six in 2005. Rig movement out of the US is covered below.
ATTRITION CONTINUES TO AFFECT AGING US RIGS
Despite strong commodity prices that prompt drilling contractors to reactivate rigs, marginal units continue to be removed from service after their useful life cycle has passed. Rigs removed from the US fleet over the past year totaled 119, a decline from the 173-unit drop in 2005. Deletions were reported in three categories, Table 1:
- Rigs removed from service
- Rigs moved out of the country
- Destroyed rigs
Census rules have always excluded rigs from the available count that have been stacked for a significant amount of time or that require a large capital expenditure to be operable. These two conditions make up the category, “Rigs Removed from Service.” It is the largest category of deletions with 99 rigs, versus 141 last year. Beginning this year, “Rigs Removed from Service” will also include rigs that were previously and separately noted as “Auctioned for Parts/ Cannibalized.” Many rigs, having left the fleet after being idle for some time or requiring too much capital, later go on to become parts for other rigs. As it has become more difficult to differentiate between reasons for removing a rig from the available fleet, it was felt that this was a fine line with little significance.
Rigs typically move into and out of the country, and these rigs are tracked in the census each year. As worldwide markets experience strength similar to the US, companies sometimes move their rigs to these areas. This year, 14 rigs moved to international markets, compared with 29 last year. Considering that 14 rigs moved out of the country, while just five moved in, there was a net decline of nine units resulting from rig moves.
Rigs that were destroyed comprise the last category for deletions. An active Gulf Coast hurricane season in late 2005 left destruction in its path, with six units sustaining irreparable damage. This compares with three rigs lost during the previous census period.
Total rig additions numbered 391, while deletions totaled 119. The net change in the rig fleet over the past year was a 272-unit increase, showing a trend of favorable operating conditions for rig owners, Fig. 3.
CANADIAN RIG BUILDING CONTINUES
The Canadian market continues to see unsurpassed growth in its fleet size. According to data provided by Nickle’s Rig Locator, Canada’s numbers improved again in 2006, with the fleet gaining 73 units through rig building. Last year’s overall increase was similar at 70 units. All rigs entering the fleet this year were either newly manufactured or assembled from components. Newly manufactured rigs numbered 63 units, compared with 43 in 2005. Rigs assembled from parts made up the remainder of this year’s increase, with 10 being added. The fact that no previously existing rigs were brought back into service leads us to the conclusion that few viable rigs remain available for reactivation in Canada.
Reductions to the Canadian fleet for 2006 totaled 15 units, with eight rigs leaving the country and seven being retired or used for parts to keep other units running. Subtracting these 15 units from the 73 additions leaves a net increase of 58 rigs and a total available count of 799. This is an overall increase of 9% and another record year for rig availability in Canada, Table 2.
| TABLE 2. Changes to the Canadian rig fleet |
 |
|
GLOBAL OFFSHORE MOBILE RIGS REACTIVATED
The global offshore mobile rig fleet experienced 29 additions this year, with 20 of those being reactivated rigs. This compares with just eight units brought back into service in the previous census. Most likely, these rigs had been down for a number of years, but they eventually were brought out of retirement, due to recent favorable market conditions. The nine remaining rigs were brand-new rigs just entering the market for the first time. No new units entering the fleet this year were described as “assembled from parts.” The nine newly manufactured rigs are a small portion of those anticipated to enter the global offshore mobile fleet in the near future. ODS-Petrodata estimates that more than 90 units have been placed on order or are currently under construction as of this writing.
Reductions to the global offshore mobile fleet numbered 16 this year, a marked decline from the 45 rigs subtracted last year. Just 10 rigs were retired in 2006, versus 42 in 2005. Last year’s 45-unit decline was due primarily to census takers’ aggressive removal of a number of older units that had been stacked for many years without the ability to be reactivated quickly, thus not considered “available” according to census rules. Other rigs removed from service included the six rigs destroyed by Hurricanes Katrina and Rita during the active storm season of 2005, Table 3.
| TABLE 3. Changes to the Global Offshore Mobile Fleet |
 |
|
Overall, the net increase in global offshore mobile units was 13 rigs, bringing the available count up to 654. The worldwide offshore fleet is widely distributed with the US still dominating, followed by South America, the Middle East and Northwest Europe, Fig. 4. The fleet makeup by rig type is shown in Fig. 5, but does not include platform and inland barges in the distribution.
US ACTIVITY & UTILIZATION RISE AGAIN
The active rig count climbed another 15% this year, as commodity prices strengthened. Active rigs had not been above 2,000 since the mid-1980s, but they finally broke through, reaching 2,200 this year. Last year’s rigs identified as “working” during the census period numbered 1,920. The methodology used to count active rigs for the ReedHycalog census is different from other, active, weekly rig counts that record units drilling during a single day. The census counts a rig as active if it has “turned to the right” any time during a defined 45-day period (this year’s period was between May 3 and June 16). Therefore, the ReedHycalog statistic will always be higher than other reported rig counts, because a longer time period is used to monitor activity.
The 98 available rigs that were not working during the census period were classified according to the length of time they have been idle. Rigs stacked less than one year numbered 88; one to two years, 10; and two to three years, 0. With today’s demand for drilling rigs, it is assumed that many rigs not actively drilling are under contract and awaiting the start of their projects, or are being moved to their next drilling locations. Census aging rules state that any rig stacked for longer than three years will be removed from the available fleet, although most rigs tend to be decommissioned for other reasons before being deleted, due to their stacked condition. Rigs removed from the fleet for this reason fall into the deletions category, “removed from service.”
One figure often quoted in the census is full-year utilization, which is the total percentage of available rigs that drilled at some time during the past year. Adding the 88 rigs stacked less than one year to the 2,200 active units in the census provides this number. This full-year utilization figure indicates that owners put 2,288 out of 2,298 rigs, or 99.6% of available units, to work over the past year, as compared to 97.7% in 2005.
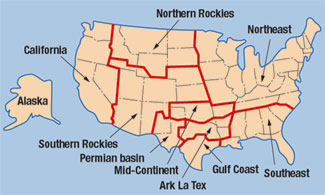
As economic conditions improved around the country, every census region reported more rigs working than a year earlier. This regional breakdown, comparing statistics for 2005 and 2006, is shown in Table 4. The ArkLaTex region again experienced the largest increase in the actual number of active rigs, up another 71 units for 2006, after a 63-rig increase last year.
 |
| TABLE 4 |
|
US regional census results
Click image for enlarged view |
|
|
Rig utilization, the supply and demand balance of rigs, is often an indicator of industry health. This ratio of active to available US rigs inched up a little further this year, to 96% from 95% in 2005. These tight market conditions lead to the belief that the industry is experiencing a much-deserved boost in strength, not seen since the early 1980s.
Although every US region reported increased rig activity this year, utilization was mixed, with some regions actually showing declines. Utilization figures for each region are as follows:
- Alaska, 95%
- Northern Rockies, 93%
- Southern Rockies, 98%
- Northeast States, 94%
- Permian basin, 97%
- Gulf Coast, 95%
- ArkLaTex, 95%
- California, 99%
- Southeast States, 95%, and
- Mid-Continent, 96%.
Many areas are now feeling the effects of demand exceeding supply for some specific rig types or locations. Although some regions experienced a slight drop in utilization, this is actually the first time in recent history that all regional areas have reported figures above 90%.
Examining US land and offshore rigs separately, gross utilization for land rigs was up to 96% from 95% in 2005, Fig. 6, Table 5. The US offshore utilization ratio made a significant leap to 97% from 90%, and now tops the land percentage. Floating rigs are in greatest demand, showing 100% utilization at census time, with all 42 units working. Rigs showing the lowest utilization are the inland barge units at 94%. Rig availability, broken down by depth capacity, showed that units in most depth ranges experienced utilization increases this year, except those rigs capable of drilling from 16,000 to 19,999 ft. This group slid from 98% to 97%, Table 6.
| TABLE 5. US land rigs, number and utilization. |
 |
|
| TABLE 6. US Rig utilization by depth capacity |
 |
|
CANADIAN ACTIVITY ON THE RISE
During the spring census period between May 3 and June 16 this year, Canada reported 669 rigs as active. This was a 22%, or 119-rig, increase from the same time period in 2005. Even more significant is that this is the second year in a row that a 22% activity increase was recorded. The Canadian utilization rate also climbed 10 percentage points, to 84% this year from 74% in 2005, Fig. 7.
The bulk of the Canadian active and available fleet resides in the 6,000-to-9,999-ft range. Fleet availability and activity by depth capacity show that utilization is highest in the >20,000-ft range (86%) and lowest in the 16,000-to-19,999-ft range (70%), Fig. 8.
INTERNATIONAL LAND RIG MARKET TIGHTENS
This was ReedHycalog’s second year to evaluate international land rig activity. Utilization rates, comparing 2006 with 2005, are shown in Table 7 for the primary international regions. As additional data have become available for other countries, they have been included. For year-to-year comparison purposes, utilization has been calculated, including these countries.
| TABLE 7. International utilization |
 |
|
It has been observed that some areas have large numbers of available rigs, but these units typically feature older technology. It is questionable whether these rigs are universally mobile or marketable. Also, in some cases, available rigs are actually under contract awaiting a project start, and are realistically unavailable for other work. The overall utilization rate for the international rig market climbed to 95% from 83% last year, with further explanation of these changes below. Continued refinement of this count will lead to future improvements in accuracy.
Areas, such as China and the former Soviet Union (FSU), were excluded from last year’s census, since their numbers were not considered accurate enough for publication. After further information gathering over the past year, they have now been included. Russian and Chinese counts, however, show 100% utilization, which greatly increases Europe’s and Asia’s overall percentages when they are incorporated. Russia and the FSU add nearly 500 rigs to this count, while China adds over 1,100 rigs.
Most international areas experienced continued tightening in land rig utilization. Statistics indicate a big jump in African utilization over the past year. Greater activity in Algeria was the principal cause of this increase. The European market showed a reduction in the utilization rate, with higher availability in Italy and Turkey being the primary cause.
UTILIZATION STAGNANT FOR GLOBAL OFFSHORE MOBILE FLEET
The global offshore mobile fleet (excluding platform and inland barge rigs) experienced a 2% rise in activity during this census period. Total working rigs numbered 557 units during the 45-day active period, up from 545 in 2005. With both available and active rigs rising in tandem, no increase in overall utilization was shown compared with the previous year, Fig. 9.
OTHER US INDUSTRY TRENDS
As the drilling industry has become revitalized, the entrance of newly established companies is becoming a trend. A low of 179 rig owners was noted in 2003. However, the industry is back up to 257 owners today, with an increase of 31 just over the past year. Although mergers and acquisitions continue to impact the industry, many small owners are finding it profitable to drill again, Fig. 10.
The census has always tracked rig ownership by drilling contractor versus operator, with considerably more rigs being owned by contractors. It should be noted, however, that more operators are now establishing their own drilling companies. This year’s census counted 28 operators, up from 17 in 2005. Operators now own about 5% of the overall US fleet, up from 3% in the last census.
Many large companies continue to increase their rig holdings. The top two contractors, alone, now own 27% of the total US rig fleet. Our statistics show that players with more than 20 units in their fleets have made the most gains in rig ownership over the past year, now owning 58% of all drilling rigs, a gain of three percentage points, Fig. 11.
CONTRACTOR CONCERNS
A survey of drilling contractors is conducted annually at the same time that the rig census is taken. This survey often reveals interesting viewpoints regarding the state of the industry. Contractors were asked to rank some major issues of importance and estimate a number of changes to their business, some comparing this year to last. Forty-eight contractors chose to participate in this year’s survey, about 19% of all rig owners, and representing 57% of the aggregate US fleet and 18% of the Canadian fleet. These companies were a wide mix in both size and regional areas represented.
For the past 16 years, respondents have been asked to rank a set of issues by importance to their business. The number one concern of contractors for the third year in a row was “crew availability,” which is not surprising, due to the high volume of new rigs entering the fleet. This issue often ranks either number one or number two. A sustainable, skilled workforce remains elusive, despite the fact that crew hourly labor rates have increased an average 17% over the past year, and rig rates have improved considerably.
The second highest concern was the availability of rig parts. For the second year in a row, contractors are troubled by attempts to locate rig parts to keep their fleets at maximum operating capacity. The aggressive newbuild program that is underway may alleviate this situation on one level. Also falling in line with equipment, the issue of third highest concern is “drill pipe replacement.” Contractors were asked to estimate their percentage of tubular goods to be replaced in 2006, because this is their largest non-rig expense. The average anticipated amount was 18%, with 29% coming from inventory and 71% from new purchases. Maintenance expenses, as well as labor, continue to escalate for contractors. On average, maintenance costs climbed another 14% this year. For the first time in the survey’s 16 years, despite escalating overhead, rig rates have not ranked among contractors’ top three concerns. This indicates that although not all is perfect, many contractors are finally prospering.
Rig activity for contractors has, on average, increased another 28% this year after climbing 18% in 2005. Land rig rates, specifically, are up about 26% for respondents. According to survey data, land rig rates in actual dollars have averaged $16,124/day during this year’s May-June period.
When contractors were asked at what level oil and gas prices would have to drop below to have a negative effect on their business, they estimated, on average, $44.70/bbl for oil and $4.40/Mcf for gas. It is interesting to note that this year’s average, necessary oil price of $44.70 is significantly higher than last year’s $30.10. It seems that as oil prices climb, expectations follow suit.
RIG BUILDING TO CONTINUE
Most contractor survey respondents predict a bright future for themselves, with steady or increasing activity over the next few years. When asked to describe their company’s plans for the next five years, more than half of all rig owners, 52%, plan to expand their fleets during this time period. Expected additions during the next 12 months for the 48 survey respondents include 75 refurbished rigs and 100 newly manufactured units for the US and Canada. Other industry sources indicate that US-based contractors are expecting at least as many newbuilds to be deployed during the coming year as were over the past year, which would mean between 200 and 300 rigs. In addition, a number of rigs that were removed from the available fleet this year were done so, because they are being upgraded. Many of these units will be reintroduced in 2007. One interesting side note is that some contractors are already voicing concern about overbuilding, therefore leading to a glut in capacity where pricing cannot be sustained at the current level.
Other markets are also experiencing a profusion of rig building. Canada expects 30 to 40 newbuilds by the next census. The global offshore market has 59 jackups, 23 semisubmersibles, 7 drillships, and 2 tender rigs, a total of 91 rigs, predicted to enter the fleet over the next several years.
FURTHER US UTILIZATION INCREASE PREDICTED
Robust commodity prices have led to a rejuvenated upstream oil and gas industry that is expected to stay strong for the next few years. The anticipated introduction of additional, newly manufactured and refurbished rigs over the coming months leads ReedHycalog to believe that the US available count will climb further in 2007, possibly by another 300-plus units. Rig activity is also thought to be on the upswing. The consensus among contractors is that the active count may rise another 15% or so by the next census. Based on this forecast, the utilization rate would remain at a healthy 96%. Now it’s time to watch how current political and economic events unfold and impact our industry over the next few months.
Census Ground Rules
- ReedHycalog sales regions were used for the geographical breakdown shown in Table 4 and the accompanying map.
- Contractor-owned rigs are those belonging to companies whose primary business is offering drilling contracting services.
- To be considered active, a rig must be drilling during the 45-day period in which the census is taken.
- Only workable rotary rigs are included; cable tool rigs are excluded.
- To be considered available, a rig must be able to go to work without requiring a significant capital expenditure.
- Rotary rigs stacked for an extended time, typically three years or longer, are not counted as available.
- A rig must able to, and normally employed for, drilling deeper than 3,000 ft. Therefore, some shallow drilling rigs (mostly in the Northeast) are excluded. This is necessary to ensure that well-servicing rigs are not counted.
- Electric rigs include all those that transmit power from prime movers to electrically driven equipment.
- Inland barges include barge-mounted rigs that may be moved from one location to another via canal, bayou or river and drill in sheltered inland waters. Offshore rigs include stationary platform units (both self-contained and tender-supported), bottom-supported mobile units, and floating rigs (both drill ships and semisubmersibles).

ACKNOWLEDGMENT
The following are recognized for their contributions to this year’s rig census: Michael Wayne (RigData); Nickle’s Rig Locator; Tom Kellock (ODS – Petrodata); Mike Critchley, Jim Elder, Kelly Hollister, Stephanie Martin, Leonora Navarre, Greg Petterson and Doug Smith (ReedHycalog).
|
THE AUTHORS
|
 |
Steve Berkman has been marketing manager for ReedHycalog since July 2004. Prior to that appointment, he served as regional sales manager in Latin America. He has been with ReedHycalog for more than 20 years, starting as a design engineer in 1982. Mr. Berkman has been all over the world with ReedHycalog in engineering and sales positions. He received a BS degree in mechanical engineering from the University of Texas in 1981.
|
|
 |
Tory A. Stokes is a consultant for ReedHycalog, after being employed by the company as a senior marketing analyst for eight years. She graduated with a BS degree in applied mathematics from Texas A&M University in 1985 and earned an MBA from the University of Houston in 1993.
|
|
|