April 1999
Industry At A Glance
99-04_what-lea_fig20.html (Apr-1999)
A monthly magazine offering industry news, statistics and technical editorial to the oil and gas drilling, exploration and production industry.
 |
|
|
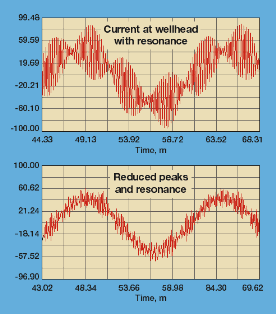
Fig. 20. Example of before and after carrier frequency harmonics. In top curve, harmonics are exciting a system resonance. After modeling with new software and adjusting the system, bottom, current peaking is greatly reduced for the same fundamental current. |
|
|
|
Copyright © 1999 World Oil
Copyright © 1999 Gulf Publishing Company

