Industry at a glance
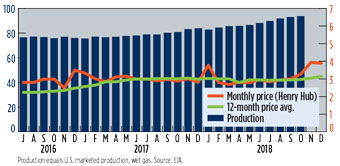
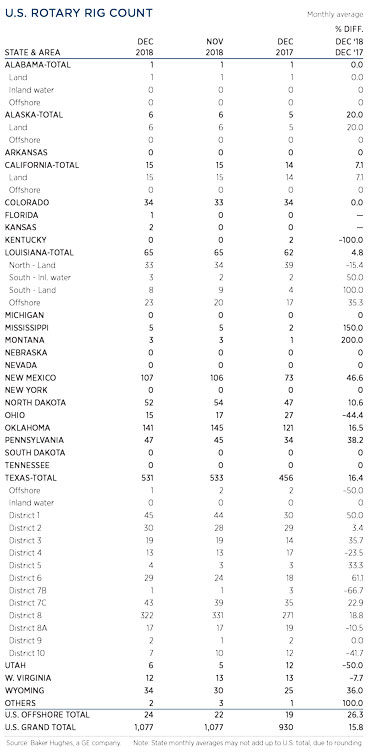
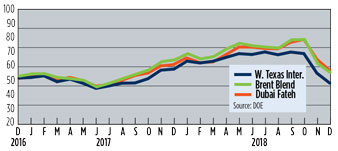
Steadily increasing output from the U.S., Russia and Saudi Arabia (34.04 MMbopd), combined with concerns about China’s economy, upset oil markets. Crude benchmarks, which declined 18% in November, continued on a downward trajectory, as WTI plunged from $53.58/bbl on Dec. 13 to just $42.53 on Dec. 24, only to jump back to over $48 on Jan. 4. Brent fell from $61.45 on Dec. 13 to $50.47 on Dec. 24, and then rose to $57.35 on Jan. 4. To bolster prices, OPEC cut output 530,000 bopd, its sharpest reduction in two years. U.S. gas prices remained relatively high, with Henry Hub trading at $3.89/MMbtu in December. The U.S. rig count was unchanged, averaging 1,077 units in December. Permian activity slipped five rigs, while international activity decreased 1.7% in November. ![]()
U.S. GAS PRICES ($/MCF) AND PRODUCTION (BCFD) GRAPH
U.S. ROTARY DRILLING RIGS GRAPH
U.S. ROTARY DRILLING RIGS TABLE
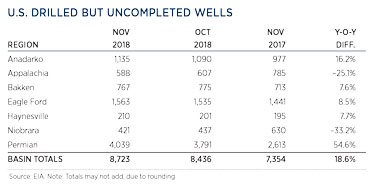
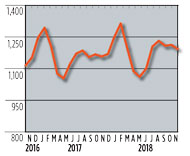
U.S. DRILLED BUT UNCOMPLETED WELLS
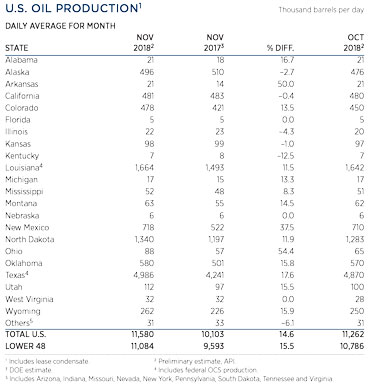
U.S. OIL PRODUCTION TABLE
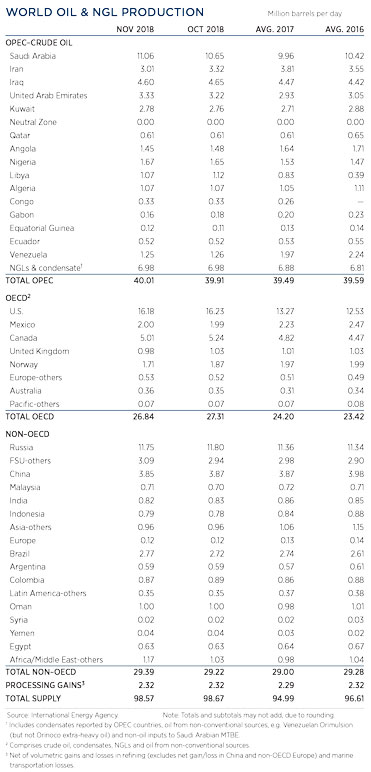
WORLD OIL PRODUCTION TABLE
SELECTED WORLD OIL PRICES GRAPH
INTERNATIONAL ROTARY RIG GRAPH
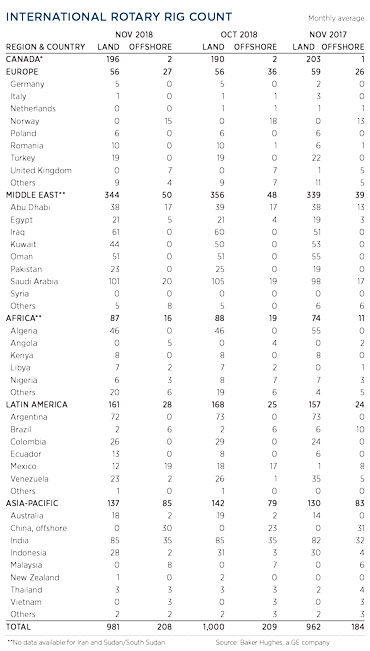
INTERNATIONAL ROTARY RIG TABLE
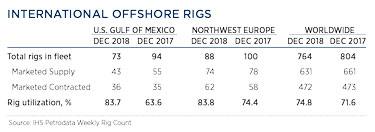
INTERNATIONAL OFFSHORE RIGS TABLE

- Management issues- Dallas Fed: Activity sees modest growth; outlook improves, but cost increases continue (October 2023)
- Industry at a glance (June 2023)
- Industry at a glance (May 2023)
- Management issues- Dallas Fed: Oil and gas expansion stalls amid surging costs and worsening outlooks (May 2023)
- Executive viewpoint (April 2023)
- Global offshore market is on the upswing (April 2023)

