U.S. drilling plateaus, modest increase seen for second half
Although the U.S. E&P industry has experienced a significant recovery since the 2016 trough, a conservative mindset still lingers, due to the severity of the bust, especially in oilfield service (OFS) companies. The substantial ramp-up in U.S. drilling activity was due largely to OPEC’s well documented production cuts—among its members and Russia—that removed approximately 1.6 MMbopd from world markets and placed a solid floor under crude prices. This, combined with major concessions from the OFS sector, has enabled U.S. operators to increase ROI and return to profitability.
THE MACRO U.S. PICTURE
Indicators. The Baker Hughes rotary rig count, the industry’s premier health barometer, stood at 1,048 active units the week ending Sept. 7, 2018. That total is about 58% higher, or 383 rigs more than were working on Jan. 6, 2017. But, compared to the year-ago tally of 944, the current count is just 11% higher, indicating pipeline constrains in the Permian basin (Fig. 1), and uncertainty fueled by the trade dispute with China, will force operators to remain cautious about increasing activity in the second half of the year.
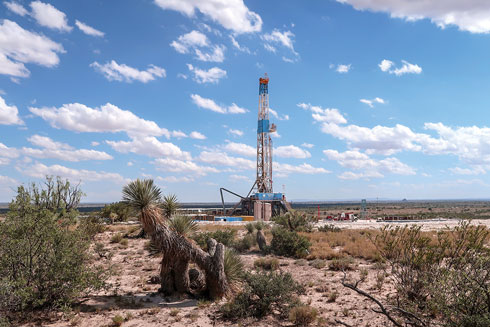
Another telling statistic is the unprecedented backlog of wells waiting on completion (DUC), which increased to 8,033 during July 2018. And in the Permian, DUCs surged 167 wells in July to 3,470, a 49% increase from a year earlier and the highest number since EIA began tracking them in 2013. This significant amount of stranded capital also will give operators pause before pulling the trigger on more drilling in 2018.
On a positive note, U.S. capital expenditures are forecast to increase $14.8 billion, year-over-year, during 2018. Furthermore, World Oil’s mid-year survey respondents have indicated that they will increase their wells drilled 10.4% during the second half of the year.
Overall forecast. With these statistics in mind, World Oil forecasts a modest drilling increase for the remainder of the year, projecting 27,184 total wells for 2018—a 15.5% gain from the 2017 count of 23,543, Table 1. Total footage is projected to climb from 265.6 MMft in 2017 to 319.6 MMft in 2018—an increase of 20.4%. During 2018, 13,252 wells are estimated to have been drilled during the first six months, while 13,932 are expected to spud in the second half of the year, for a half-to-half gain of 5.1%. Also, a 5.0% increase in footage is on tap for the last six months.
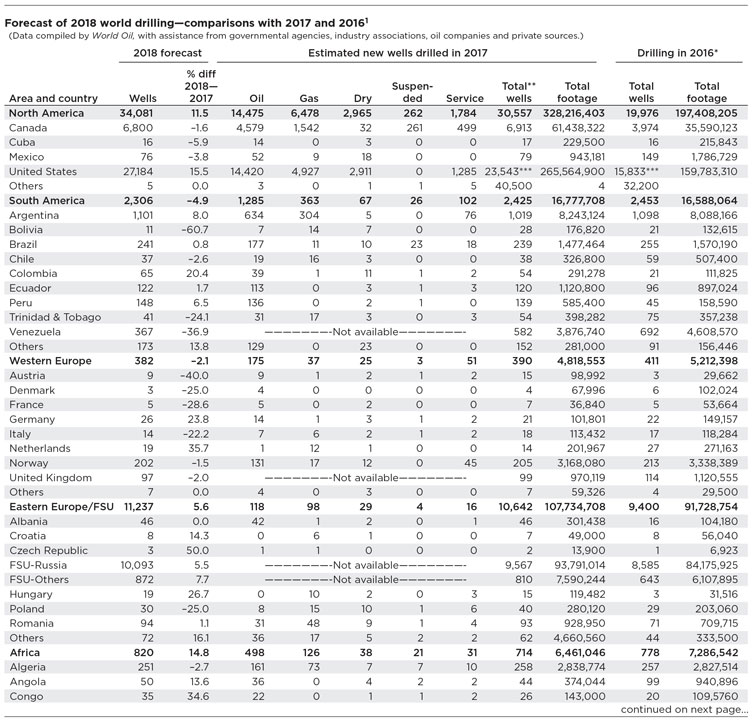
The modest gain in drilling activity suggests that the U.S. E&P industry is pausing to reassess its assets and allow additional infrastructure to be built that will enable operators to more efficiently move product to market. While shale companies are itching to tap their “undeveloped” acreage, the growing number of DUCs indicates a reduction in activity might be more prudent to recoup drilling costs, rather than loading more wells in the queue. Realistically, it will take several years to pare-down the 8,033-well logjam, and the extended down-time could damage boreholes and hurt project economics. And some wells may never be completed. Nevertheless, in spite of these factors, we have seen a number of operators revise their 2018 guidance higher during July and August, indicating a still-somewhat bullish mentality exists in some areas.
However, from another angle, operators must continually drill wells to remain profitable, and a global crude shortage could push prices higher. In August, supply disruption risk increased because of Iranian threats to block the Strait of Hormuz, plus Saudi Arabia’s decision to halt oil shipments through the Bab al-Mandeb strait amid Yemeni Houthi rebel attacks in July.
In any case, it appears that oil companies have evolved adequately to remain solvent against a backdrop of lower prices. However, as profitability returns, the risk of returning to old spending habits could reappear. Yet, many analysts believe that the industry has learned a lesson, which will have a lasting impact, now that producers have found smarter ways to operate. Against this yin-and-yang backdrop, World Oil presents its 2018 mid-year forecast for the U.S.
North American capex set for modest gain. The brutal oil price crash and monumental bust of 2015–2016 is in the rear-view mirror, and the North American (NAM) E&P recovery is set to continue, albeit at a rather modest pace. By year-end, NAM spending is expected to increase 14%, from $104.3 billion in 2017 to $119.1 billion in 2018, according to the 2018 Global E&P Mid-Year Spending Outlook from Evercore ISI. The definitive report authored by James West—senior managing director at the investment bank—is gathered from a twice-yearly survey and was released on July 18.
Evercore forecasts that U.S. operators will lead the capex gain with a 16% increase over last year’s level, from $90.1 billion in 2017 to $104.4 billion in 2018. For Canada, E&P spending is projected to rise only 3%, from $14.3 billion in 2017 to $14.7 billion in 2018. Evercore revised its 2018 capex 3% downward in Canada, compared to an initial estimate of a 9% gain, due to takeaway constraints and unfavorable oil price differentials.
The revision to Evercore’s 2018 capex estimates is directionally consistent with the 15%-to-20% ascension of WTI and Brent prices through the first half of the year. Oil prices reacted favorably to the measured output agreement announced in late-June, which should support spending in the back half of 2018. Evercore predicts that oil prices will remain conducive for incremental capex into 2019.
NAM shale continues to be the hotspot for capex growth, despite the malaise in Canada. However, as the year progressed, the limits of shale have materialized, and lofty production growth assertions have proven to be overly optimistic. NAM shale is a commoditized business, but as resource optimization progresses and geological constraints tighten, the bar will continue to be set higher. As expected, 2018 has defined the limits of shale production growth, and attention is shifting toward international resources, where the economics have become increasingly competitive.
COMMODITY PRICES/OUTPUT
The well-publicized production cuts by OPEC and Russia had a beneficial impact on oil prices during first-half 2018, despite surging output from U.S. shale fields. The ad hoc cartel managed to remove 1.6 MMbopd from world crude markets through the end of July 2018, and beyond. Although the threat of surging U.S. supply loomed large, logistics issues and a lack of pressure pumping equipment in the Permian basin helped to limit hydrocarbons from entering the market.
The supply restriction and resulting drawdown of global stockpiles—which remain lower than the five-year average—started to take hold during fourth-quarter 2017, when WTI and Brent averaged $56/bbl and $62/bbl, respectively. Once momentum started to build, the foundation set by stable commodity prices lingered through the first quarter of this year, with a noticeable uptick in prices as WTI ranged between $58/bbl and $64/bbl from December 2016 to March 2017, while Brent varied from $64/bbl to $67/bbl during the same period.
With OPEC+ adhering to reductions, and with Permian flow restricted, prices continued their upward march during second-quarter 2018, with WTI averaging $68/bbl, and Brent trading at $74/bbl. Finally, by the end of July, benchmarks appeared to reach equilibrium at $71/bbl (WTI) and $73/bbl (Brent). The price differential between WTI and Brent is due partially to the higher shipping costs required to move product from Midland to the Gulf Coast.
Short-Term Energy Outlook (STEO). The ebb and flow of crude prices in the second quarter was discussed in EIA’s STEO report, published in August 2018. “Crude oil prices declined during July, as several key oil producers increased production from the first half of 2018, and as a major supply disruption that many analysts expected to persist for several months was resolved quickly.”
Crude production from most OPEC members and Russia was estimated to be higher in July, compared with the first-half 2018 average. In addition, a faster-than-expected return of Libyan oil production—following an unplanned supply outage—put downward pressure on oil prices. Inventories remain slightly lower than five-year average levels, and outages could cause prices to increase.
Brent spot prices are expected to average $72/bbl in 2018 and $71/bbl in 2019. The EIA predicts that WTI will average about $6/bbl lower than Brent in 2018, as well as in 2019. NYMEX WTI futures values for November 2018 delivery suggest a range of $54/bbl to $84/bbl, a rather wide, volatile swath.
U.S. crude output. EIA projects that U.S. oil production will average 10.7 MMbpd in 2018 and 11.7 MMbpd in 2019. If realized, both forecast levels would surpass the previous record of 9.6 MMbpd, set in 1970. The increase will be driven primarily by shale oil from the Permian basin in western Texas and eastern New Mexico. The region is expected to account for about half of the nation’s projected production growth through 2019.
Natural gas prices unchanged. In spite of a relatively cold winter and increased demand caused by four straight nor’easters that pounded the eastern U.S. seaboard in March, natural gas prices remained subdued during first-half 2018, averaging $2.97/MMBtu. The lone exception was in January, when Henry Hub prices spiked at $3.77/MMBtu, but then dropped back to $2.80/MMBtu in February. To the chagrin of producers, the average gas price during second-half 2017 was just $2.93/MMBtu.
The EIA forecasts that Henry Hub spot prices will average $2.96/MMBtu in 2018 and $3.10/MMBtu in 2019. NYMEX futures contracts for November 2018 delivery suggest a range of $2.33/MMBtu to $3.48/MMBtu.
Natural gas production/exports to rise. The U.S. shale plays, which have boosted crude production, also have contributed to increased gas output. EIA forecasts that dry natural gas production will average 81.1 Bcfd in 2018, up 7.5 Bcfd from 2017’s level, and thus establishing a new record high. Gas production will rise again in 2019, to 84.1 Bcfd. EIA reported that production in the Appalachian basin, Permian basin and Haynesville shale have grown to account for 50% of domestic output, up from 15% in 2007. Conversely, the Gulf of Mexico (GOM) accounts for just 3% of U.S. natural gas production, down from 12% in 2007.
After importing gas for 60 years, the U.S. became an exporter of the fuel in 2017. During June 2018, two new pipelines were placed in service that will distribute U.S. gas to Mexico. The EIA forecasts that pipeline exports, which averaged 6.7 Bcfd in 2017, will average 7.0 Bcfd in 2018 and 8.5 Bcfd in 2019. In addition, completion of the Cove Point LNG export terminal, on Chesapeake Bay (Maryland), brings the number of U.S. LNG exporters to two. The EIA forecasts that LNG exports will rise from 1.9 Bcfd in 2017 to 3.0 Bcfd in 2018, and up to 5.1 Bcfd in 2019.
U.S. rig count plateaus. While walking rigs/pad drilling and better prospect selection played a role in improving economics, the reduction in service costs was the primary factor that enabled operators to kick-start the recovery. Evercore estimates that overall services pricing fell by up to 70% from the 2014 peak to the 2016 trough. Pricing recovered about 15% by mid-year 2017, and it appears to have increased another 15% over the past year. This implies average services pricing has recovered only 32% from the trough. Considering this major loss of revenue, the OFS sector has done an exemplary job of funding R&D and launching new technologies, while operators reap the benefits without exposure to the development risks.
The combination of cut-rate services and rising oil prices caused the U.S. rig count’s weekly figure to grow 13%, or 119 active units, since the end of 2017, with the most recent count on Sept. 7 coming in at 1,048. The slowing activity has been caused by pipeline bottlenecks that are so pervasive that companies are mothballing drilling projects and shutting-in existing production.
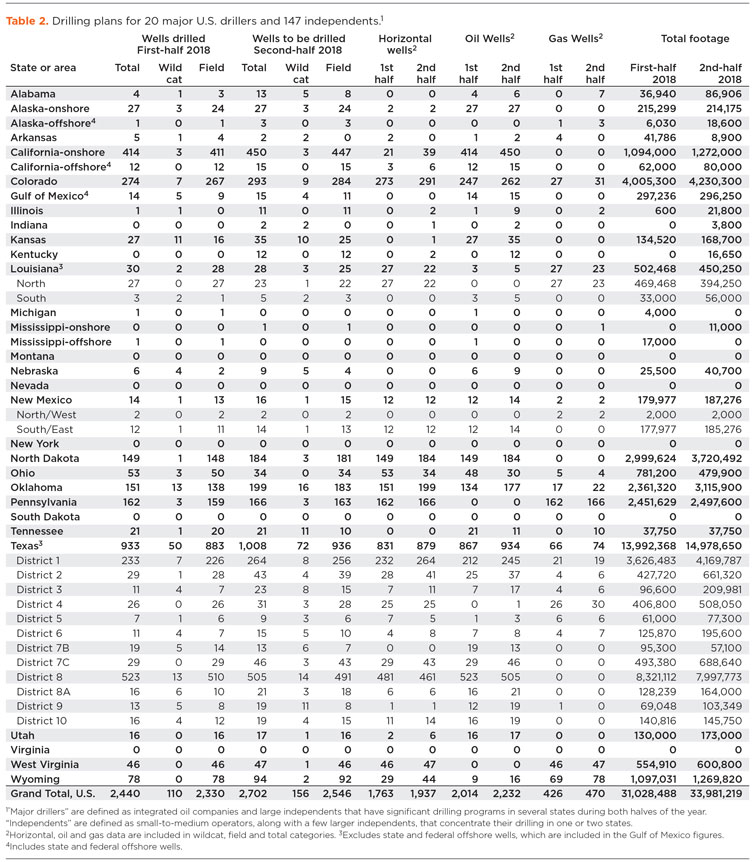
Survey results. World Oil’s operator survey (Table 2) reflects optimism among respondents. The larger operators, referred to as “major drillers,” expect to increase their 2018 drilling 9.9% during the second half. In contrast, smaller independents are more bullish, collectively expecting to boost activity 12.2%. Together, the survey group will increase drilling 10.7%. Exploratory wells remain a very small component, totaling 4.5% in first-half 2018 and 5.8% in the second half. Oil-directed drilling comprises 85.5% of wells in the first half and 82.6% in the second half.
Gulf of Mexico remains subdued. The deepwater portion of the U.S. GOM (Fig. 2) was hit hard by the collapse in oil prices and is falling further behind the booming shale fields. According to World Oil’s survey results, and federal officials’ outlook, well counts will not recover during second-half 2018. World Oil forecasts that GOM activity totaled 60 wells in the first half of the year, with another 61 scheduled to be drilled in the second half of 2018. The projected 121-well total will be 18.2% lower than the 2017 figure of 148. Indeed, our operator respondents’ combined tallies show that their GOM activity will remain flat from first-half 2018 to the second half.
Despite the lackluster drilling activity, Shell released details, in February, about one of its largest GOM finds in the last 10 years. The Whale deepwater discovery encountered 1,400 ft of oil-bearing Paleogene pay, 3 mi northeast of Silvertip field and 10 mi from the Perdido platform. Shell also is perusing three other deepwater GOM projects at Appomattox, Kaikias and Coulomb. Meanwhile, Chevron announced a major deepwater discovery at its Ballymore prospect, where 670 ft of Norphlet oil pay were encountered.
Although a U.S. tax overhaul and improved efficiencies have increased the fiscal competitiveness of the deepwater GOM environment, a meaningful recovery does not appear likely in first-half 2019, either.
Nevertheless, the GOM should contribute to U.S. production growth, increasing 158,000 bopd during 2019, to average 1.9 MMbopd. The EIA forecast makes this region the second-largest U.S. growth contributor from 2018 to 2019. It will be driven by ramp-ups at two new fields that started producing in 2017, and the anticipation of 10 new fields starting up in 2018. Additionally, another six new fields should come online during 2019. The 18 fields are expected to contribute 480,000 bpd within the total GOM figure of 1.9 MMbopd during 2019.
STATE-BY-STATE OUTLOOK
Texas. Obviously, the Permian basin is the main engine of growth in the Lone Star State, and, for that matter, the entire U.S. Lured by prolific sub-basins; multiple, stacked pay zones; and high IPs, producers that already have a Permian presence have added to their holdings, while other operators are attempting to gain toeholds. And this behavior continues, despite a laundry list of nettlesome problems, including pipeline capacity constraints; high acreage costs; shortages of pressure pumping capacity and crews; increasing sand costs; and a truck driver shortage.
Accordingly, we forecast that Railroad Commission Districts 8 and 8A (two of three districts covering the Permian) will be up 27.6% and 8.7%, respectively, for 2018 as a whole, compared to 2017’s level. The third Permian area, District 8A, will actually be down 9.6%. However, 8A should see a 7.7% rebound in the second half. Given the problems cited earlier, we expect District 8’s growth to slow to 2.0% in the second half, while District 7C appears to be impervious to District 8’s problems and will grow just over 20% in the second half. Permian regional production is forecast to average 3.3 MMbpd in 2018 and 3.9 MMbpd in 2019. Recent pipeline capacity constraints have dampened wellhead prices for the region’s producers and will slow growth in 2019 compared with 2018.
As some operators lose patience with the Permian’s growing pains, they are transferring some of their activity to the Eagle Ford shale of South Texas (mostly in Railroad Commission Districts 1 and 2). Indeed, we predict that Districts 1 and 2 will be 12.8% and 2.0% higher, respectively, than their 2017 totals. And when one looks at second-half activity vs. the first half of this year, Districts 1 and 2 will be up 10.9% and 5.9%, respectively. The Eagle Ford’s output should increase by about 105,000 bopd from 2018 to 2019, to average 1.5 MMbopd. Although the Eagle Ford has fewer prolific formations, compared to the Permian, it has adequate pipeline capacity.
Elsewhere in Texas, one can say that the Permian and Eagle Ford have, so to speak, sucked out most of the oxygen from the room. Those two plays comprise 81% of all Texas drilling. Nevertheless, there are some signs of improved gas drilling in Districts 3, 4 and 6, the latter forming part of the rebounding Haynesville shale. And in Districts 5, 7B, 9 and 10, there are signs of renewed shallow oil drilling in conventional plays, along with a small wave of localized wildcatting, all bolstered by higher oil prices.
Oklahoma. Based on comments from operators’ quarterly reports, the renowned SCOOP and STACK plays remain pertinent and prolific. Glowing reports from Continental and other leading players speak of high IPs obtained from ever-lengthening laterals. They refer to some of their wells in these plays as being the best performers in their entire portfolios. So, it’s no surprise that Oklahoma’s drilling for 2018, overall, will be up 9%, with second-half vs. first-half activity gaining 5.7%. EIA expects SCOOP/STACK production to average 550,000 bopd in 2019.
Louisiana. Drilling activity continues to lag and disappoint through most of Louisiana, and this is despite a rebound in the Haynesville shale, taking place in the northern part of the state. For 2018, overall, Louisiana’s drilling will be flat with the 2017 total at 655 wells. And even when comparing the two halves of 2018, activity still remains flat. Look for the state’s northern half to finish about 4% lower in the second half of the year, vs. the southern half improving 13.8%. Due to its lower rate of activity, the southern half is not able to make up the loss in the northern portion.
North Dakota. The Bakken shale play remains very important to this state, as well as to the nation as a whole. Coming out of the 2016 trough, operators drilled 1,035 wells last year, and they are on track to post an impressive 25.6% gain during 2018. In addition, the area should post a second-half gain of 6.3% vs. the first-half well total. Bolstered by drilling efficiency gains and ever-longer laterals, some of the leading operators, like Continental Resources and Hess, are posting impressive IP rates.
In the Bakken, production has reached a record high in 2018, averaging 1.3 MMbopd. It is forecast to increase to 1.4 MMbopd during 2019. Although the Bakken spans 200,000 mi2, it contains fewer producing formations and is adversely affected by winter weather. The recent production growth has been supported by the removal of pipeline capacity constraints that affected the region before 2017.
Northeast (Pa./W.V./Ohio). In the northeastern U.S., the Marcellus shale continues to drive activity. After six decades of importing natural gas, the U.S. became an exporter of the fuel in 2017, due in large part to production from the Marcellus shale. Dominion Energy’s massive $4-billion investment, in its new Cove Point LNG export terminal in Maryland, speaks volumes about the sustainability of natural gas production in the region.
Drilling activity in Pennsylvania is tapping the high-quality reservoir (Fig. 3) at an increasing rate. According to operator survey results, nearly all of the respondents’ wells drilled in 2018 will be gas wells. World Oil forecasts a modest gain of 3.5% in Pennsylvania’s second-half activity, compared to the first half. But for the year, drilling will be up 17.2%, compared to 2017’s level. In West Virginia, the story is similar but even more robust. As operators tap the Marcellus in the northwestern half of the state, drilling will increase 7%, second half vs. first half. And when 2018’s drilling is compared to 2017’s level, activity will be up 33.5%. In Ohio, where drilling in the Utica is split between oil and gas activity, operators are still struggling, with this year’s well total expected to finish slightly under last year’s level. Nevertheless, some recent improvement will drive activity 12.8% higher in the second half of this year.
Rocky Mountains. There is considerable excitement in this region, particularly in Colorado and New Mexico, where strong operator interest in the Niobrara shale/DJ basin and Permian basin, respectively, is driving activity higher. We forecast that Colorado will see its drilling rise 4.4% in second-half 2018 vs. the first half, and the well total for the year, overall, will be up a very solid 12.7%. Our survey respondents are in relatively close agreement with these numbers. Accordingly, the Niobrara is expected to average 670,000 bopd in 2019.
In New Mexico, operator fervor for the Permian is making a huge difference in the state’s drilling numbers. Compared to 2017’s level, the 2018 well tally should be up about 46%, to a lofty 2,030. While the gas-prone San Juan region in the northwestern part of the state is still struggling, the Permian sector in the southeast has seen activity grow at a frantic pace through the first half of the year. However, that level of drilling is about to level out and decline slowly in second-half 2018, due to many of the same pipeline and logistical issues that are affecting the Texas side of the basin. Hence we expect second-half drilling to decline 6.7%.
In Utah, where activity in the Uintah basin has been recovering slowly, drilling is up a nice 14% from 2017’s figure, but the difference between the two halves of 2018 will be very modest. Other than a small share of Bakken shale drilling that is growing, Montana’s mostly conventional activity remains somewhat depressed.
Alaskan activity remains stable onshore, but the offshore picture remains cloudy. The collapse of oil prices drove a stake in the heart of activity offshore Alaska, forcing Shell to terminate its offshore drilling campaign for the foreseeable future. However, IHS Markit believes that Alaska’s North Slope is poised to re-emerge as a major source of U.S. energy production in the next several years. The company estimates that the region holds 38 Bboe and 50 Tcfg of remaining recoverable reserves.
Despite the significant investment and remoteness of the area, World Oil forecasts a 16.2% gain in activity for the remainder of the year. Operators working in Alaska drilled 68 wells in the first half of 2018, with another 79 scheduled to be drilled in the second half. The projected 147-well total, however, will be 4.5% lower than the 2017 figure of 154.
California. As oil prices continue to recover and remain higher, drilling is surging forward in California. Operators working in The Golden State drilled 1,223 wells in 2017, most of them onshore for low-viscosity crude. World Oil estimates that 695 wells have been drilled in the first half of 2018, and that 756 will be drilled in the second half—for a total of 1,451 wells during 2018, a year-over-year increase of 18.6%. ![]()


- Applying ultra-deep LWD resistivity technology successfully in a SAGD operation (May 2019)
- Adoption of wireless intelligent completions advances (May 2019)
- Majors double down as takeaway crunch eases (April 2019)
- What’s new in well logging and formation evaluation (April 2019)
- Qualification of a 20,000-psi subsea BOP: A collaborative approach (February 2019)
- ConocoPhillips’ Greg Leveille sees rapid trajectory of technical advancement continuing (February 2019)

