Enhanced comprehension of production mechanisms improves Wolfcamp performance by 70%
Technology advancements have moved activity in West Texas toward the Wolfcamp formation of the Delaware basin. Typical Ward County completion practices, since 2013, show Wolfcamp wells have increased in lateral length and total proppant volume by approximately 2,000 ft and 1,500 lbm/lateral ft, respectively.However, the industry still needs to optimize completion practices, to improve overall well performance.
Generally, shale completions have a significant pressure decline within a short time, resulting in a challenging production performance. One of the suspected root causes is ineffectiveness of the stimulation treatments. Furthermore, rock-fluid interactions between the hydraulic fracturing fluid additives and the formation might be adversely impacting the well performance. To successfully solve these issues, three critical questions needed to be answered: 1) What happened during the well completion?; 2) Why did it happen?; and 3) What changes are required to improve performance of future wells in the area?
FRACING BACKGROUND
The first Delaware basin horizontal well drilled by the operator landed 150 ft below the top of the Upper Wolfcamp shale. It was hydraulically stimulated with 22 stages, using a crosslinked gel fluid carrying a total of 400,000 lbm of proppant, at a pump rate of 65 bbl/min. The main proppant types were 100 mesh, 40/70 sand, and 20/40 sand, with the 20/40 proppant accounting for most of the total proppant volume pumped. After the well was completed, the post-job production performance was less than expected. Additionally, the flowing wellhead pressure dropped 70% within the first two months of production, indicating some form of fracture damage or impairment resulting in subpar performance.
To address this, a direct connection between the completion performance of the hydraulic fracture networks and the production response had to be established. The workflow, described by Ejofodomi in URTeC 2172668, was applied on the initial well to determine the calibrated hydraulic fracture profile and the resulting reservoir depletion footprint. The process is as follows: 1) reservoir characterization; 2) description of the preexisting discrete fracture network; 3) hydraulic fracture calibration/fracture gridding; and 4) historical production calibration.
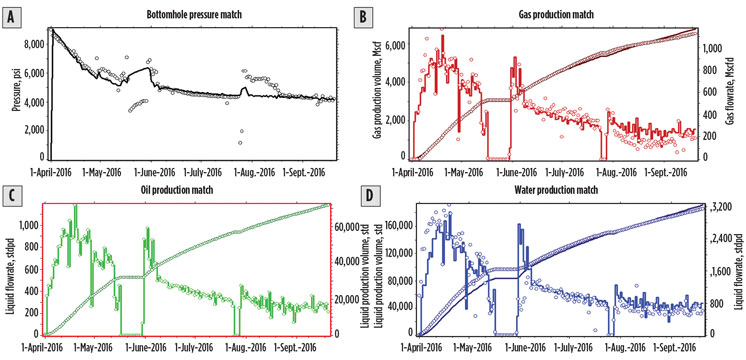
Figure 1 shows the results of the calibrated production history-matching process from the unconventional, numerical reservoir model. The results revealed some degree of inconsistent depletion along the wellbore, probably due to reservoir heterogeneity and the resulting fracture initiation and coverage across the stimulated intervals.
In addition, the extent of the overall well depletion was limited to just 200 ft on either side of the wellbore. This limited drainage—based, in part, on the restricted fracture surface area—is a direct cause of the observed flowing pressure degradation. These observations suggest that there might be opportunities to improve the completion strategy, to ensure consistent coverage along the lateral with further drainage away from the wellbore, to maximize well performance.
COMPLETION OPTIMIZATION
Properly developing an optimized completion strategy requires three components: 1) understanding the production-driving mechanism, 2) maximizing reservoir contact, and 3) maximizing lateral wellbore coverage. A calibrated integrated model was built with the Kinetix Shale reservoir-centric stimulation-to-production software and was used to perform numerous sensitivity tests to determine the relative impact of various completion parameters on well production. Parameters investigated include fluid type/volume, proppant type/volume, pump rate and proppant concentration. A one-year forecast with a fixed bottomhole pressure was assumed for all cases.
When the predicted production results were compared to the properties of the simulated fracture geometry, a practical correlation was identified in one situation. The extent of the propped fracture surface area exhibited a strong correlation to the resulting oil production. The result indicates that an expansive fracture system of low-to-medium conductivity results in better production performance, compared to a smaller fracture system of high conductivity, at least in this part of the basin.
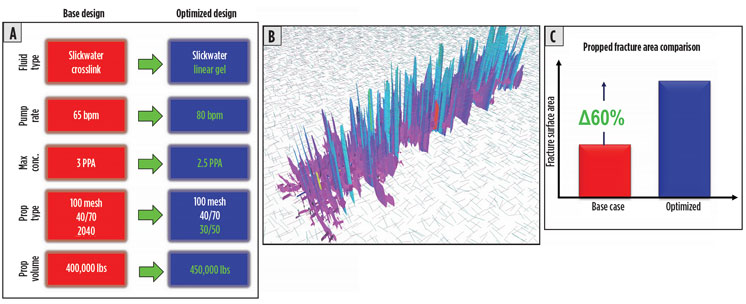
Armed with this knowledge, a new pump schedule was developed that increased the propped fracture surface area 60%, with a predictive production increase of 30% compared to offset well performance, Fig. 2. The thicker crosslinked fluid was replaced with a hybrid of predominantly slickwater and linear gel to facilitate the creation of larger fracture surface area. The pump rate was increased to 80 bbl/min., to enhance the proppant transport and facilitate the creation of larger propped fracture surface area, and the largest proppant mesh size was reduced from 20/40 to 30/50 for the same purpose. In addition, a slightly more conservative proppant ramp was deployed.
To achieve consistent wellbore coverage, ThurBit dipole acoustic through-the-bit logging services and Pulsar multi-function spectroscopy measurements were acquired on the planned horizontal well to obtain geomechanics and petrophysics data, respectively. The goal is to place the perforations within a given stage across similar type rock that has good hydrocarbon presence, and to facilitate the capability to initiate and create fractures uniformly across all perforation, while maintaining connectivity back to the wellbore.
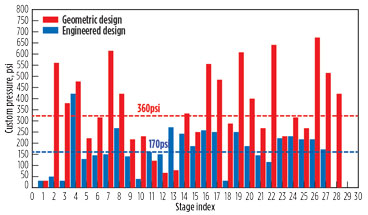
This difference along the wellbore presents a challenge in ensuring consistent wellbore coverage from the stimulation treatments, without some form of engineered staging and perforation strategy. A total of 27 stages were identified with a combination of three or four perforation clusters per stage, depending on the respective stress profile. Overall, by utilizing this process, the average stress contrast was reduced 50%, thus increasing the likelihood of breaking down all the perforation clusters to achieve similar injection rate profiles, resulting in total lateral coverage, Fig. 3.
Rock-fluid interactions. Formation damage and subsequent decrease in reservoir permeability and fracture conductivity strongly affect oil and gas production during hydraulic fracturing operations. In very low-permeability reservoirs, an alternate solution to hydraulic fracture optimization has often centered on creating very large fractures with very little conductivity required for hydrocarbon flow.
If, however, during this process, the formation-fluid interaction results in significant damage to the rock, it might not only compromise the permeability of the formation, but also could result in the effective collapse of the hydraulic fractures. This, while technically a conductivity issue, manifests as a smaller-than-desired hydraulically stimulated area. Therefore, it is critical to understand the type and degree of damage caused, and change the operating practices accordingly.
Formation damage is a result of rock’s varying mineralogical composition and physico-chemical properties, and can occur through mechanical or chemical mechanisms. This section specifically focuses on the formation damage caused via wettability alterations, clay swelling and deflocculating, and fines migration, which can be mitigated using surfactants and clay stabilizers. Our strategy included a thorough investigation and evaluation of these additives on the planned well.
Surfactant and clay stabilization tests were performed using well-established laboratory techniques. These methods were developed specifically for ultra-low-permeability shales, for which it is otherwise difficult to perform any quantitative measurements in a reasonable time, and they enable us to measure the saturation-dependent capillary pressure.
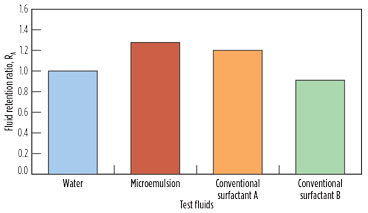
To demonstrate the effect of the additive on the cleanup process, three surfactants were studied, and their performance was compared to that of fresh water. These surfactants were selected, based on their different chemistries as either microemulsions or conventional surfactants. The impact of these surfactants was assessed, based on the fluid retention ratio (RA), which essentially is the measure of the flowback-aid performance on the specific rock material. Ratios lower than one indicate a positive effect on the clean-up process; the lower the ratio, the better is the additive performance. Fluid retention ratios above one indicate that the additive damages the formation. Testing revealed that the microemulsion demonstrated a cleanup ratio greater than one, implying that it was, in fact, detrimental to the formation and could potentially cause damage to the fracture conductivity and near-wellbore permeability, Fig. 4.
The optimum results were shown by conventional surfactant B, which had the least fluid retention ratio, indicating its increased efficacy towards the formation cleanup. In addition, the selected optimum surfactant was significantly cheaper than the original additive pumped on the offset well.
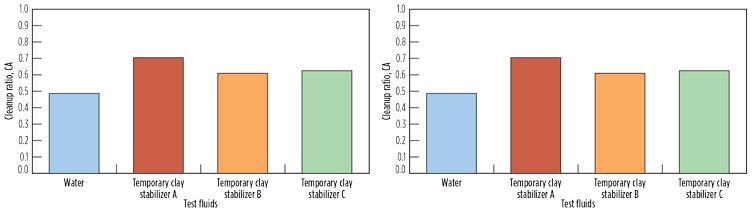
The lateral measurement acquired on the horizontal well revealed differences in the reservoir properties along the wellbore. The toe section was predominantly characterized by lower porosity and lower stresses, whereas the heel section exhibited higher porosity and higher stresses. Although a consistent clay content profile was observed along the wellbore, it was suspected that the porosity difference may be due to the presence of different clay content. To evaluate any clay damage to the formation on exposure to the aqueous-based fluids, three temporary clay stabilizers, A, B and C, were tested to evaluate their impact across the toe and heel sections.
The effect of these clay stabilizers was assessed, based on the cleanup ratio (CA), which is the ratio of the permeability of the formation test pack before, and after, exposure to the test fluid. A substantial departure of the ratio from unity indicates some form of damage has been caused by exposure of the formation material to the test fluid or flow of the fluid through the material. In other words, the higher the permeability ratio, the better the clay stabilizer is performing.
Figure 5 shows the impact of different clay stabilizers across the toe and heel sections. The test confirmed that the heel section is more clay-rich, compared to the toe section, based on the different responses observed. Ultimately, the optimum clay stabilizer was selected, applicable to the entire wellbore, to mitigate any adverse effects from the presence of the clay mineral.
FIELD RESULTS
The new horizontal well, located 5 mi west of the original well, was drilled in the Upper Wolfcamp shale. The optimized hybrid pump schedule and perforation strategy were executed, as per the design, throughout the 27 plug-and-perf stages of the well.
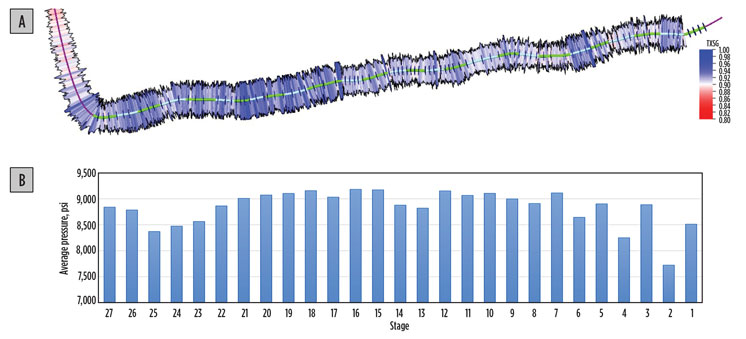
Similar trends were observed between the surface treating pressures and the stress profile from the acquired lateral measurements, Fig. 6. This provides confidence on the predictive capabilities of the applied workflow in determining the observed fracture response in the Wolfcamp shale formation. Screenout rates in this area of the field were particularly high and were taken into consideration during the design phase. The engineered perforation strategy facilitated successful proper fracture initiation and proppant placement during all stages of the treatment. All stages were completed successfully, as per the optimized design, without any pressure-ups or screenouts. The successful execution required close collaboration of the fracturing and the wireline pump-down crews. The procedures to perforate the well were adjusted to meet the optimized perforation design and accuracy requirements.
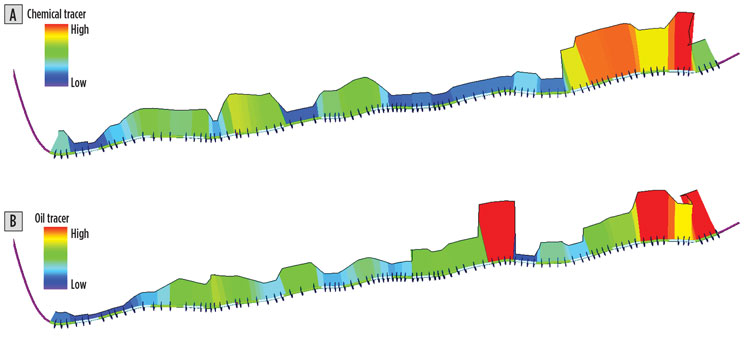
Both oil and chemical tracers were pumped on the subject well, and the results are shown in Fig. 7. The results revealed that all the stimulated stages were contributing to flow, indicating effectiveness of the optimized completion strategy that was applied.
A post-treatment calibration of the hydraulic fracture geometry was performed by matching the material balance of the injected volumes and the observed treating pressure responses. When the resulting calibrated fracture surface area was compared to the recovered oil tracers for each stage, a decent trend was observed, where the toe section of the lateral, which was characterized by lower stresses, exhibited the largest fracture area and with larger volumes of oil tracers recovered. Conversely, the heel section, which had higher stresses, had smaller fracture area with lower volumes of oil tracers recovered. This trend further corroborates the optimization.
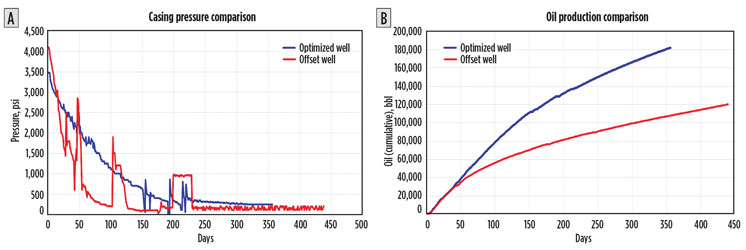
The resulting well production is shown in Fig. 8. When compared to the existing offset, the cumulative oil production of the optimized well is 70% higher. More interesting is the casing pressure comparison. Although the casing pressure on the optimized well starts about 500 psi lower than in the existing well, the decline is significantly less severe than in the existing well. These results reaffirm the following points:
- Optimum fracture geometry was created, based on the optimized Kinetix shale design.
- Optimized fluid additives played a crucial role in facilitating the cleanup and flow within the created fractures, and minimized damage effects.
- The staging and perforation strategy influenced the effective fracture coverage along the entire lateral.
Technically, it is challenging to precisely isolate which of the processes described above had the largest impact on improving well performance. To address this, the post-job calibrated fracture geometry was incorporated into a numerical reservoir model, and the historical production was matched. The resulting pressure drainage area on the optimized well was about two times that of the offset well.
CONCLUSION
The project showed that the completion optimization workflow provides significant insights on methods to improve well performance in unconventional reservoirs. The extent of the propped fracture surface area correlates directly with the production performance in the Wolfcamp shale in the Delaware basin. The new completion strategy was developed from the optimization process and was applied successfully on a nearby offset well.
- The final pump schedule resulted in a 60% increase in the propped fracture surface area, compared to the historical base case design.
- Significantly, the pressure decline was less severe.
- A rock-fluid compatibility test is an integral part of the optimized completion design process.
The test revealed the originally planned surfactant was not only ineffective, but probably caused damage to the fracture system.
- The optimum surfactant was identified, which was more effective and contributed to cost savings.
- Results from the clay stabilizer test corroborated the observed differences on the lateral measurements, which led to the selection of the optimum additive, to minimize any damage from the presence of the clay mineral in the formation.
Lateral measurements played a critical part in optimizing the staging and perforation strategy.
- The average stress contrast was reduced 50%.
- Proper fracture initiation and placement with effective coverage across the intended intervals was achieved.
The post-job results on the optimized well indicate a huge improvement, compared to the nearby offset well.
- Tracer results showed that all the stages were flowing and contributing to production.
- A good correlation was observed between the calibrated fracture surface area and the recovered oil tracers.
- Significantly less pressure decline was observed on the optimized well, compared to the offset.
- The cumulative oil production of the optimized well was 70% higher in the first year. When accounting for proppant volumes and lateral length, the optimized well still outperforms by 40%.

ACKNOWLEDGMENTS
This article was adapted from URTeC paper 2836566, which was presented at the Unconventional Resources Technology Conference, held in Houston, Texas, July 23–25, 2018.

