Permanent downhole temperature sensing succeeds for low cost wells
Several low-cost DST wells have been successfully installed in Brunei.
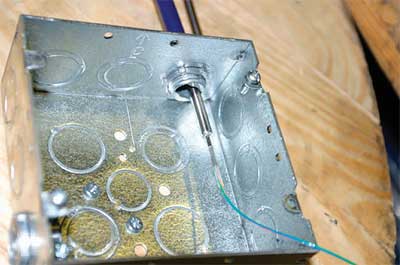
INTELLIGENT WELL COMPLETIONPermanent downhole temperature sensing succeeds for low cost wellsSeveral lowcost DTS wells have been installed onshore and offshore Brunei.Dino Simonits, LIOS Technology GmbH, and Andr� Franzen, Shell International E&P B.V., Rijswijk Oil and gas producers continuously face the challenge to optimize output and reduce operational costs further. For a decade, permanent, optical inwell monitoring systems have gained increased acceptance in upstream production operations. However, so far, mostly highend and, therefore, usually complex (mainly deepwater) wells were the focus for these socalled intelligent completions. Large investments for the surface equipment, installation complexity, and the lack of standard tools for efficient data gathering and analysis, were the main reasons for the general hesitation toward this technology. A major breakthrough is still awaited. In a cooperative effort between Shell International Exploration and Production (SIEP) and LIOS Technology GmbH (LIOS), the feasibility and economic added value of permanent downhole temperature sensing have been successfully demonstrated in a number of recently deployed on and offshore projects in Brunei. This article presents the generic design and implementation of an exemplary case study for permanent downhole, Distributed Temperature Sensing (DTS) of lowcost land and offshore wells. The entire scope of equipment and architecture, from the wellsite to the office, is accounted for, with a view toward fitforpurpose, commercially sustainable and costeffective technical solutions for the enduser, the asset owner. INTRODUCTION Right from the oil industry’s beginning, people wanted to know more about the reservoirs that they were exploiting. This included having a more sound understanding about reservoir behavior and obtaining knowledge on how to optimize hydrocarbon recovery. As it was, and still is, impossible to look directly into a reservoir, other ways to obtain information about it needed to be investigated. Direct surface measurements were helpful and are still required today, but downhole sensing quickly became an important topic for reservoir monitoring. The first sensors were for pressure measurements and then temperature. Nowadays, microsensing images a whole ground section in 3D. A lot of information can be derived from relatively easy temperature measurements along the borehole. The advances in fiber optics and packaging, and the experience gained over the last five to 10 years, has enabled the industry to deliver lowcost DTS systems. An additional factor has been further development of industry standards and electronics, enabling personnel to build an architecture that allows data flow from the well to the production technologist’s desk. FIBER OPTICS’ EARLY DAYS IN E&P All sensors deployed in E&P needed to be developed and adjusted for this specific application field, and thus became more rugged over time, whether it was/is hydraulic, electrical or optical equipment. As such, all novel technology has to prove itself, and at the early stage, there is always a steep learning curve associated with it. Unfortunately, fiber optics, when it was introduced into E&P, did not have the maturity level of what oilfield personnel expected in general, especially when compared with field equipment for items like beampumps, ESPs, inflowcontrol devices, etc., and thus could not compete with alternative technologies. As a consequence, only for specific applications, i.e. deepsea wells, could the relatively high costs for fiber optic developments be justified.1 EXPERIENCES�EARLIEST TO LATEST Despite numerous, reported early stories of successful downhole monitoring deployments with fiber optic sensorseither pointtype gauges (pressure) or distributed sensors (DTS)�its broad breakthrough in upstream oil and gas operations is still awaited. In a world of rugged drilling equipment and harsh offshore environments, the fiber was still looked at with skepticism. This resulted in hesitation that was constantly fueled by typical teething troubles during the first commercial deployments. The release of premature surface equipment yielded unsatisfactory performance in terms of reliability, measurement stability and service life. Based on development work initiated in 1995,2 LIOS provides DTS systems, based on Optical Frequency Domain Reflectometry (ODFR). The light source used is a modern, durable semiconductor laser diode, instead of a rather complex solidstate laser that typically powers Raman OTDR systems. The semiconductor laser diodes used have been critically typetested according to the Telcordia3 GR468 standard and are fulfilling telecommunication standards with a medium lifetime of > 25 yr. Not only has the laser diode been tested, but also the entire system has been comprehensively tested by various independent international bodies (e.g., the Germany VdS, the association of German asset insurers). In these situations, EMI tests, as well as endurance tests at accelerated aging environments, were conducted. Systems in various application areas have been deployed in worldwide projects totaling more than 1,000 permanent installations since 1997. This extensive track record has led to constant performance improvement in hardware and software, plus the capability of deploying sensing equipment. GENERIC SETUP FOR LOWCOST DEPLOYMENT To give an overview of DTS implementation in E&P, a generic setup is presented. In the generic layout, sensing is executed downhole with a fiber optic cable (Fig. 1), while the actual interrogation is carried out on the surface, where the data is also collected. From here, the raw data is transferred by some means, e.g., WiFi, twistedpair, etc., to a central location where the measured information is stored in a database. Production Technologists (PTs) and Reservoir Engineers (REs) can retrieve the required information from the database, using appropriate software, i.e., visualization software, that presents the information graphically, or an analytical tool that helps to evaluate the data.
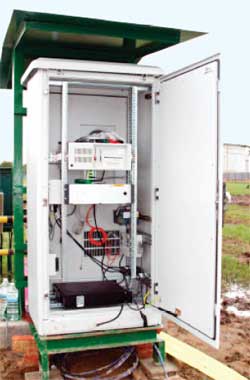
This setup is fundamentally different compared to the time when fiber optics was introduced into E&P. The possibility of having online data�which means that no one has to go to the well site to collect data�is a major change. Additionally, the optical equipment was adjusted to the E&P environment, so it now has a small footprint and is rugged enough for field deployments. Most changes are not due to the advances in fiber optics, but to the progress in communications, especially with Ethernet, TCP/IP and WiFi being wellestablished. Another helping factor is the standardization of interfaces. This not only refers to the hardware interfaces but to software. A new interface standard for upstream DTS measurement devices called Energistics WITSML (Wellsite Information Transfer Standard Markup Language, now maintained by Energistics, www.energistics.com)4 was introduced and integrated for the first time, thus allowing raw data to be inserted into a Shelldeveloped and owned database (which will be made publicly available shortly). To recap, the main focus remains with the fiber optic sensor and interrogation unit, as these are the elements that differ most from other previous electrical deployments in price and technology. The fiber needs to be deployed along the well’s casing and must be packaged accordingly. A control line with a plastic encapsulation has shown that it gives sufficient protection against wear and tear, Fig. 1. Another aspect that has changed over time is the footprint and power consumption of DTS readout units. From bulky cupboards that they used to occupy, these units now fit into a 19in. rack, and even smaller sizes are predicted, Fig. 2. Some designs use, e.g., 120cmhigh racks, whereby more than half the space is used for Uninterruptable Power Supply (UPS) and only onethird of the remaining space for the actual DTS evaluation unit.
Still, to have a truly successful lowcost DTS deployment, an architecture allowing measurement data to be streamed into a database is required. This is shown in the next section. LOWCOST DTS PILOT PROGRAM The field trial consisted of three main parts. These are identified by physical locations�well site, transmission and central office or headquarters. At the onshore well site, a fiber optic cable was installed downhole with the help of a local crew (which obviously has a cost impact). At the cable’s end, a minibend was mounted, a device establishing a light return path over submm space and thus enabling two optical fibers to connect inside a 1⁄4in. control line. This allows a doubleended system. The DTS evaluation unit at surface measures both ends of the fiber alternately. Results of the measurements are collected onsite and then prepared, according to the Energistics standard for transmission. Initially, this was carried out by a PC running the required software, but at a later stage in the trial, it was done by an embedded Linux system, which became part of the DTS box. A similar scenario can be found in an offshore installation. There, an existing fiber optic cable was used, and only the abovedescribed surface equipment was installed, including a UPS. The transmission is based on TCP/IP, and thus a wide variety of transmission media is available. All of those solutions are commercially and readily deployable. In the land trial, WiFi was used to overcome a distance of about 1.5 km from the well site to the headquarters of Brunei Shell Petroleum (BSP). The offshore setup uses a combination of WiFi, microwave and land line. Due to the endtoend use of TCP/IP from the well site to the office domain, configuration and maintenance access is available. The operator can easily configure various DTS systems installed at remote well sites, onshore and offshore, from the office. For the DTS measurement data, a different transfer procedure was established. To avoid congesting the network, a special remote transfer agent was developed that transmits the generated Energistics files at predefined intervals. Stateofthe art industry standard TLS encryption and authentication protects against intrusion or data sniffing. At the central office, the data are received, verified and inserted into the aforementioned Shelldeveloped Distributed Production Data (DPD) database. This database was optimized to handle large data arrays, typically generated by DTS systems. It, too, can store vast quantities of DTS wells, possibility up to several assets. In the office, the PTs and REs can query the database and get measurements displayed on the desktops, using a visualizer that was developed as an Excel addon. Figure 3 shows the generic deployed architecture as described above.
DTS SYSTEM IMPLEMENTATION The DTS surface equipment for the lowcost land wells comprises an OTS40P system with four fiber optical measurement channels. Each channel covers a range of up to 4 km of a singleended multimode fiber. The vendor’s product portfolio consists of DTS systems with ranges of up to 15 km at a singleend multimode fiber, with up to eight measurement channels. In this case, the distributed temperature profile along the wellbore is provided with a spatial resolution of Data and event processing are handled by the DTS system, itself. Temperature and backscattering profiles are provided via its Ethernet interface through TCP/IP. Whereas the initial setup required a local PC to store data and generate the Energistics WITSMLcompliant protocol data, the latest setup is designed without an additional PC onsite. The newly available Embedded Communication Module (ECM) for the DTS incorporates onboard storage of all measurement data for more than 72 hr, plus the Energistics WITSML protocol generating engine and the automated transfer procedure into the DPDdatabase. Direct benefits for the operators of this highly integrated setup are reduction of cost and power consumption for the well surface equipment, a simplified configuration procedure and a smaller total footprint for the system. MEASURING PRINCIPLE/OFDR TECHNOLOGY The DTS evaluation unit deploys the method of Raman backscattering light detection in the frequency domain (OFDR). The OFDR system provides the distributed temperature profile along the fiber, therefore the Raman backscatter signal detected during the entire measurement time is recorded as a function of frequency in a complex fashion, and then subjected to Fourier transformation. The essential benefits of OFDR technology are the quasicontinuous wavemodes deployed by the laser and the narrowband detection of the optical backscatter signal, whereby a significantly higher signaltonoise ratio is achieved than with conventional pulse technology (OTDR). This benefit allows the use of affordable semiconductor laser diodes and electronic assemblies for signal averaging. This is offset by the technically difficult measurement of the Ramanscattered light and rather complex signal processing, due to the FFT (Fast Fourier Transformation) calculation with higher linear requirements for electronic components. DATA PROCESSING AND DATA FLOW This project also focuses on integrated solutions with direct benefits for the daily operation of the involved asset�measurement data shall be at the direct disposal of the PTs and REs. The schematic in Fig. 4 demonstrates the generic data flow from DTS systems at the well site to the office domain.
Energistics WITSML data generation. The DTS system transmits its measured data using Energistics files according to the latest Energistics/WITSML version 1.3.1 specifications (now part of PRODML, www.prodml.org and www.energistics.com).5 The petrotechnical protocol standard, Energistics WITSML, ensures compatible data streams of distributed temperature profiles, backscattering profiles and event data. It is a logical protocol structure based on XMLcoded text files and data streams. The measurement data are compressed to optimize the flow. Energistics files are generated and stored on the ECM of the DTS system. Data transfer to the office domain/remote backup. To automatically transmit all measurement data from the DTS to the office domain, a product called RemoteBackup was used. It can either be run on a PC where the measurement data are gathered onsite, or executed as a plugin module on the embedded system in the DTS box. The RemoteBackup application copies exported measurement data from a remote installation over an encrypted network connection to a central location. It consists of one computer running the RemoteBackup Client (typically in the office domain) and an arbitrary number of machines (either PCs or ECMs), each running the RemoteBackup Server. The client will automatically detect and connect each remote server over an authenticated and encrypted channel, and receive remote measurement data files. Measurement data will be checked on the server and client side, to ensure that data are transferred only once. Data only transferred partially, e.g., due to network problems, will be automatically continued during a later session. This optimizes use of the network’s bandwidth. The complete backup process uses secure, stateoftheart authentication and encryption, according to the TLS6 Version 1 Internet standard. Thus, it is protected against all known kinds of attacks. Database interfacing/HTTP upload. Shell uses an Oracle database to store the DTS data. It contains a server that can receive data through the industry standard HTTP protocol8 and is also capable of interpreting XML files, as well as inserting data contained therein into a database. For security reasons, no direct connection exists between the systems creating the Energistics files (DTS or PC) and the database server. Therefore, an additional application was developed to transfer the Energistics files collected by the Remote Backup client in the office domain to the database using the HTTP “PUT” mechanism. The application supports both HTTP authentication and TLS6 encryption to allow its use in securitysensitive environments. The application reads back the HTTP status code from the database server after the transfer of each Energistics file, and it is able to either erase or archive the Energistics files, based on the status reported by the server, allowing verification of the data. The HTTP PUT tool is designed to run unattended, to make minimum user interaction necessary. Embedded P/T gauge data. A variation to the above described scenario is the Charon 02 visualization software that is preliminarily designed to store and visualize OTS controllerdistributed temperature data. Its XMLIOS feature extends the functionality to thirdparty sensors and data sources. This feature also enables acquisition of pointtype data. The received data will be stored in the Charon 02 database and can be visualized, printed and exported. Data acquisition is based on a threelayer model:
Each mentioned layer may be located on a different host. Further details are shown in Fig. 5.
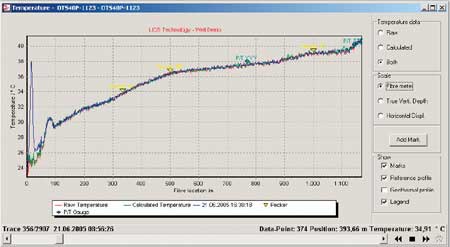
Data visualization. An efficient visualization is essential to evaluate measured data. The amount of data produced by a DTS is enormous. At a given sensor fiber length of 10 km, it may result in up to 65,536 data points every 30 sec. This scenario could produce more than 7 million data points per hour. Additionally, longtime monitoring will increase the data volume significantly. This overallscenario is quite challenging for data transmission, management and visualization. The DTS system, of which Charon 02 is a part, provides all these features. However, for a largescale deployment, the DPD database is the preferred solution. Charon 02 provides the display of temperature measurement data and backscattering data in the Stokes and antiStokes channel as a function of distance. Zooming, panning, printing and exporting to ASCII text files are implemented, as well. A software interface for direct data exchange (DDE) is available to publish the data to third party software (e.g., Math Lab, MS Excel). The dynamic behavior of the temperature profile along the wellbore can be revealed by replaying the traces sequentially. Measurement traces will be displayed like a time lapse movie, forward and backward, at a userdefined speed. Temperature trends may be identified and inspected by displaying data in the time domain. Navigation, in terms of time and position, is easily achieved by doubleclicking a position or time stamp. Customized visualization options for E&P show temperature against True Vertical Depth (TVD) and Horizontal Displacement (HZD). This implies that data can be loaded containing TVD/HZD vs. alonghole depth data, to reconstruct the well trajectory and plot temperature against TVD/HZD, Fig. 6.
Loading or specifying a geothermal gradient through copy/paste from MS Excel determines the gradient in the TVD/HZD view. Important points along the wellbore (e.g., the position of P/T gauges) can be marked through the user interface in Charon 02 at specific depths, and displayed at all temperature windows using selected symbols and a short text. Charon 02 can be used in the operator’s native language. Charon 02 comes with these language sets: English, German, French, Italian, Portuguese, Danish, Simplified Chinese, Traditional Chinese and Korean. A software tool can be used to customize the Charon 02 application and to fit the software to the operators’ demands. CONCLUSIONS The authors have presented several successful lowcost DTS installations at BSP in this article, both onshore and offshore. This shows that once certain maturity and robustness in a technology have evolved, and an agreement on standards has been implemented, lowcost equipment can be designed, manufactured and deployed, even for lowcost wells. The applied design and working practices enable permanent inwell sensing for a largescale rollout. Additionally, a DPD database has been developed and successfully deployed. The PTs and REs in BSP now have full access to the lowcost DTSinstalled wells around the clock, every day of the year.
|
||||||||||||||||||||||||||||||||
- Coiled tubing drilling’s role in the energy transition (March 2024)
- Advancing offshore decarbonization through electrification of FPSOs (March 2024)
- Shale technology: Bayesian variable pressure decline-curve analysis for shale gas wells (March 2024)
- Subsea technology- Corrosion monitoring: From failure to success (February 2024)
- Using data to create new completion efficiencies (February 2024)
- Digital tool kit enhances real-time decision-making to improve drilling efficiency and performance (February 2024)

