GEOLOGY AND GEOPHYSICS
Regional 3D stratigraphic
modeling improved
These models allow the robust linkage of system tracts between exploration and field development activities, with operator data being integrated when available.
Adam Finn, Neftex Petroleum Consultants Ltd., Abingdon, UK
Normal 3D models are built over a single reservoir or a few neighboring reservoirs, and even regional mapping tends to cover relatively small areas. A few years ago, building an integrated 3D model covering an area as large as the Middle East and North Africa would have been unthinkable. However, with the rise of 64-bit computing and lower cost, high-performance desktop workstations, the vision of a single 3D regional subsurface model is now attainable.
Formed in 2001, Neftex is a UK-based international geoscience consultancy specializing in the provision of sequence stratigraphic models for E&P companies. Its customers include 13 of the world’s largest E&P companies. The company specializes in the interpretation of geoscience data sets (e.g., outcrop, subsurface, drilling and engineering) and the delivery of these as integrated subsurface models. Its vision is to provide a single digital global structural and stratigraphic subsurface model in 3D.
It was within this context that the consultancy decided on Roxar’s reservoir modeling software IRAP RMS as the vehicle to meet its goals of a regional 3D integrated subsurface model. These models allow the strong linkage of system tracts between exploration and field development activities, with operator data being integrated with model data as necessary.
MOVE TOWARD 3D
One of the consultancy’s main products is its Middle East and North Africa (MENA) regional, online database. It offers the interpretation of complete sequence stratigraphy and petroleum geology of the MENA region. The database consists of publicly available information, which is then interpreted by the consultancy’s geoscientists.
As a 2D geo-database, the benefits were worthwhile, but there was a growing move toward integrated 3D models. The company knew it was filling an important gap in the market with its stratigraphic models, but wanted to give clients an integrated 3D model that provides a fully accurate geometric representation of the structural and stratigraphic compartments within the exploration reservoir.
Geology is itself three dimensional, and 3D models of source rock, reservoir and seal help reflect this, with the increased visualization capabilities also helping to control quality of interpretations from plate to pore.
The 3D model of the MENA region is called the MENA Cube. It’s the only 3D sequence stratigraphic project database covering the entire MENA region. The result for customers is better prediction of subsurface risks, such as source rocks, seals and traps. It also allows developing of QC field reservoir models within a 3D regional framework.
THE SOFTWARE
What was essential in developing the Cube was that we not compromise any of our original data in taking it 3D. We needed a modeling package that had sufficient robustness and scalability to handle large amounts of data on the fly. In contrast to many other software packages, the Roxar modeling software operates on all common 64-bit platforms.
The software allowed us to honor the original data, build the 3D models in considerable detail with high data volumes, and provided the necessary robustness to calculate complex algorithms. And for clients, operating on all 64-bit platforms meant there would be no compromising of performance with the ability to run larger, more detailed models from the desktop at high speeds.
Fourteen fully integrated software modules including mapping, modeling, planning and workflow management tools. All modules operate seamlessly together, leading to a dynamic and closely integrated modeling workflow.
IMPORTING DATA AND WORKFLOW OVERVIEW
The sheer amount of data and maps that were to be imported into the model was immense. It consisted of the mapping of up to six regional horizons over an area about 8,000 km by 3,000 km, the importing data from over 1,500 wells, more than 150 regional cross-sections, over 600 digitized field depth contours and more than 200 GIS facies maps, Fig. 1. Data now being loaded to the MENA Cube include some 30 additional regional depth maps, 500 new wells and over 5,000 outcrop sections.
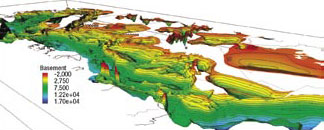 |
Fig. 1. A view of MENA Cube with North Africa in the foreground and the Arabian Peninsula beyond. Grid size is about 8,000 km x 3,000 km, with 1,000-m increments.
|
|
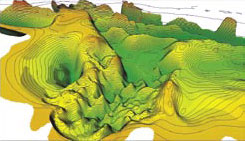 |
Fig. 2. A detailed view of North Africa Cube (view northwest to Hassi Messaoud, national boundary in red).
|
|
The grid scale was chosen at 1,000-m increments—a level of detail that ties exploration to production, thus meeting oil companies’ needs, but also ensures that the time to manipulate and visualize the models was not too excessive.
Experience showed that the best workflow (Fig. 3) for the MENA Cube, where large datasets within the software model had to be managed over regional scales, consisted of:
1. Loading wells, surfaces, GDE maps and cross-sections
2. Re-gridding the depth maps and tying them to the cross-sections, fields and wells
3. Creating isopach maps, which display the stratigraphic thickness of the rocks
4. Checking for consistency.
Furthermore, with the mapping having a different scale of operation from regional mapping, different mapping algorithms were selected to tie the regional depth surfaces to the 600+ field depth surfaces. The consistency of interpreted horizons was also checked at each stage.
THE RESULTS—COMPLETE 3D
The MENA Cube was first released in 2006 and, as newly interpreted wells are incorporated into the data, updated versions are released each month. The result for subscribers is a completely scalable 3D product tying field developments and exploration together into one subsurface model. This allows increased efficiency and better stratal and geometric understanding, leading to reduced risk and increased value.
Specific features of the MENA Cube within the software model follow.
Well correlation. One particular software module that is a key tool of the MENA Cube is RMSwellstrat, a well-correlation tool that allows us to group wells by classification, create well fence diagrams, view well trajectories and log data in 3D. This is in addition to integrating other important reservoir data, such as seismic, fault information and existing maps.
Scalability. With the rise in 64-bit computing and the unrivalled scalability of the modeling software, users can run Cube at high levels of performance.
Typical required hardware to run the Cube is 4–16 gigabytes of RAM, 370 gigabytes of hard drive space and a high-specification graphics card. With many geoscientists and reservoir engineers now having access to workstations with these specifications, the Cube can be used across the workflow team.
Improved visualization and geology. The improved and faster visualization capabilities allow users to run stratigraphic models from the desktop in greater detail and to a higher degree of accuracy. By accurately representing the reservoir and with the use of geographic coordinate systems (taking into account that the earth is not flat), a fully integrated structural and stratigraphic interpretation of the regional reservoir objective can be developed, as well as improved volumetric estimates.
Next steps—A new level OF MODELING
The company is looking to incorporate ever greater detail into the Cube through the addition of second-order depth surfaces (~40) tied to wells and well “sticks,” the creation of isopach maps, depth and temperature maps and even object modeling (e.g., highstand carbonate platforms, lowstand clastic wedges, etc.) during play fairway evaluation.
Twelve depth maps are at the final stage of refinement using the latest interpreted well picks to tie to the surface, as well as well sticks gathered from field depth maps. Over the next few months, an additional 500+ wells are likely to be incorporated into the model.
Of particular interest is another software module, RMSfaultseal, an easy to use, multi-platform fault seal analysis solution that will analyze fault zone properties within the integrated reservoir model workflow. Through this module, there will be a greater acknowledgement of faults within the stratigraphic analysis.
We are obviously proud of the MENA Cube, which we believe is an industry first. The Cube, operating within the Roxar’s software environment, has high levels of visualization, integration, scalability and structural understanding, all in a unique 3D, regional subsurface model. We feel that it is helping to unify exploration and development activity and take exploration mapping and regional model building to a new level.
|
THE AUTHOR
|
|
Adam Finn joined Neftex Petroleum Consultants Ltd as a geomatic technician. He is leading the company's drive to construct plate-scale 3D models of the entire sequence stratigraphy of North Africa and the Middle East, basement to surface. In 2003, he earned a BSc in geography at Coventry University. He previously worked at the Defence Geographic Center as a Geospatial Analyst, where he was responsible for developing a variety of maps. Contact: adam.finn@neftex.com
|
|
| |
|