Integrating technology for improved reservoir characterization
GEOLOGICAL / GEOPHYSICAL MODELINGIntegrating technology for improved reservoir characterizationA new salt model, built from integrating several technologies, led to improved development and increased reserves in a mature fieldGerald Markowitz, Texaco; Robert D. Mann, George R. Kear, Sammy S. Haddad and David O. Gillis, Schlumberger
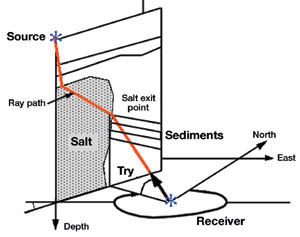
Background Vermilion Bay field is located in Iberia Parish, Louisiana, about 110 mi west of New Orleans. The field is a shallow piercement salt dome that lies in the prolific Middle and Lower Miocene producing trend of southern Louisiana. Situated between West Cote Blanche Bay field to the east and Redfish Point to the west, this predominantly gas field was one of the first discovered by geophysical surveying in open water. The discovery well, the S/L 334-B3, Bay 15s-5e, was drilled by the Texas Co. (Texaco) on July 23, 1939. Before this discovery, eight dry holes had been drilled on the structure. Since then, Texaco has drilled more than 100 wells surrounding this shallow piercement salt dome at Vermilion Bay field. Stratigraphy / structure. Vermilion Bay field is a complexly faulted, shallow piercement salt dome. Salt has been penetrated as shallow as 265 ft. The deepest well and stratigraphic test is the Superior S/L 334 VB-B1. The well penetrated the Lower Miocene, Siphonina Davisi sand / shale sequence between 15,790 and 19,300 ft (TD). The deepest producing zone is the Lower Miocene Marginulina Ascensionensis A-4 sand, in which gas was found in Superior B1 at 14,941 ft. Production from the dome extends up to 7,740 ft from the Middle Miocene Bigenerina Nodosaria sand in the Texaco S/L 334-B4 well. Field-wide cumulative production exceeds 270 Bcf gas and almost 5 million bbl oil. Early drilling around the dome clearly indicated a pronounced salt overhang between 5,000 and 8,000 ft. Drilling confirmed the presence of a major unconformity at the top of the Middle Miocene Cristellaria-I zone. Dips on the south flank of the field can change from 30° above the "I" zone, to over 70° below the unconformity. These steep dips do not extend very far from the flanks of the salt body. Hydrocarbons around the field – with the exception of the Marginulina Ascensionensis sands – tend to have columns that exceed 1,500 ft in height, but are often confined in a narrow band extending out no more then 500 ft horizontally from the salt flank. Seismic. More than 300 mi of digitally recorded seismic data has been shot around the Vermilion Bay structure, ranging from 12 to 60 CDP. Most of this data is only fair in quality. In 1982 – 84, Superior Oil, as part of a joint venture with Texaco, acquired numerous seismic lines around the field. Although much of the data has been reprocessed, it is still of insufficient quality to allow mapping the structural and stratigraphic complexities of the field with confidence. In 1990, 30 mi of state-of-the-art, 60-CDP seismic data was acquired by Texaco as test lines for a future 3-D survey. Data quality was good. In the mid-1990s, a 110 mi2 3-D survey was acquired. In early 1999, a 30-mi2 subset of the survey over the dome was prestack depth migrated. Data quality was significantly improved over most of the field, except near the salt face, where seismic quality was fair to poor. However, many drilling leads were developed; these employed both time and prestack-depth 3-D data sets plus well control. Drilling. In 1961, Texaco drilled the S/L 334-B40 well on the southwest flank of the field. The well encountered the salt top at 5,520 ft. After drilling more than 2,500 ft of salt, the well encountered a normal Middle Miocene sand / shale section. The well continued to 12,500-ft TD. Several thick, well-developed sands were logged, but the only pay was a 10-ft-thick gas sand at 9,940 ft. Mapping, using the 3-D time volume, indicated that the salt-sediment interface was farther from the B-40 well than previously thought, and a seismic event could be followed from a 300-ft-thick wet sand in the B-40 – structurally updip at least 600 ft – before reaching salt. The proposed reservoir would be bounded to the north by a large, 450-ft, down-to-the-south fault, bounded to the south by a smaller down-to-the-north fault, and open to the aquifer to the west. The proposed well would extend over 2,200 ft from drill site to TD and avoid the salt overhang. The well was drilled to 11,530-ft MD (10,550-ft TVD), and logged nearly 200 ft of pay in the Middle Miocene Operculinoides B4 Sand. The objective was encountered 595 ft updip of the sand in the B40 well. Log evaluation showed a gas / oil contact in the middle of the sand. Immediately, offsets were planned to fully exploit the new discovery. Given the poor-quality seismic near the salt flank, difficulty of sand correlation between wells, and recent successful use of salt-proximity surveys in defining the southern salt flank, it was decided to try to define the updip extent of the newfound reservoir with a salt-proximity survey. A concurrent decision was made to perform a pressure-transient test to attempt delineation of the bounding faults, and a Formation Micro Imager (FMI) was run to confirm the steep dip and locate faults. Near that time, a prestack depth migration volume was completed. This new seismic volume was a significant improvement over the 3-D time volume. The steeply dipping beds and salt flank were better imaged, and for the most part, salt interpretation from the new volume agreed with the well control. However, the data had to be pushed to its limits, with beds dipping over 70°and a narrow band of hydrocarbons up against the salt. For every 100 ft closer to the wellbore the salt flank lies, 275 ft of structure is lost. Therefore, it was critical to know the exact placement of the salt / sediment contact. One solution was to model this interface in 3-D, tying in salt-proximity and well-control information. This ongoing study resulted in a better picture of the salt body and allowed a quick way to review proposed drilling locations and optimize positions of future wellpaths. Theory / Methods: 3-D Proximity The salt-proximity computation has been in use since its original description in 1931 and its first hand-computation described in 1949.1,2 The method involves measuring the refracted travel path of seismic energy, from a source located above the salt, through the salt body, and out its flank through sediments to seismic receivers in the borehole. The method has evolved significantly since that time. Current ray-tracing techniques for salt-proximity computation can take into account velocity models, which use structural-dip measurements from dipmeter-type logs, and mapped salt tops from surface seismic and / or well-control data. Using directional, multicomponent borehole-geophone measurements along with downhole-gyro devices, the angle, in 3-D, of the first acoustic arrival at the geophone can be precisely determined. The downhole gyro provides a translation of the tool-axis-referenced geophones to true north. Using 3-C geophones, the vertical and horizontal arrival-angle components can be incorporated into a mathematical model. This model is used to provide a 3-D solution for the salt-to-sediment interface. Computation of the arrival direction is performed by use of a hodogram technique: cross-plotting the first-arrival amplitude within a defined time window at the downhole receivers. The results give horizontal and vertical arrival vectors for incoming acoustic energy, Fig. 1.
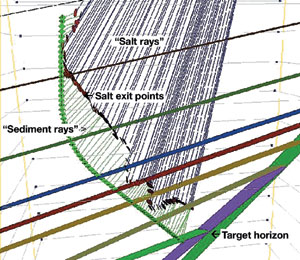
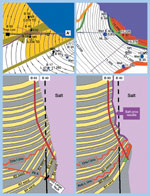
If the earth volume between source and receiver were uniform, the horizontal and vertical waveform vectors would be oriented directly toward the source from the borehole receiver. However, this is rarely the case when working with acoustic refraction by salt structures. Because of this, it is essential to know the orientation of borehole geophones, the borehole track and acoustic-arrival angles. A final computation is made using downhole gyro data to determine sonde orientation, which enables determination of the arrival direction for the acoustic vectors at each borehole receiver. Gulf of Mexico application. Commonly, with salt-proximity processing in the Gulf of Mexico (GOM) region, a great amount of acoustic travel time is spent in the low-velocity layers, above the salt body. Therefore, knowing the correct depth to salt and "overburden" velocity is critical to accurate computation. The second slowest acoustic speed commonly occurs in salt-flank sediments, between the salt and borehole receivers. Salt velocity is assumed homogeneous, which may not be strictly true, but is good enough for determining the salt-flank location near the borehole. Experience to date shows that salt structures on and near the GOM shoreline tend to be less homogeneous and contain some evaporites other than salt, as well as some silts. This consideration is significant for processing salt-proximity surveys in the GOM region. On- and near-shore salt structures may contain sufficient amounts of higher-velocity evaporites to require increasing the salt velocity more than expected. The amount of silt and clay has been found to have little effect on lowering salt velocity, but it may have other effects on acoustic-energy transmission. However, the authors have found that far offshore in the GOM, deeper salt bodies can be assumed to contain more-pure salt and, therefore, have a more-characteristic salt velocity. An additional observation is that a large velocity contrast between the salt body and surrounding rock is needed for accurate salt-proximity computations. In fact, the greater the contrast, the greater the reliability and resolution of the result. 3-D ray tracing. The 3-D salt-proximity computation technique incorporated 3-D ray tracing that was performed in salt- and sediment-velocity models. The salt-velocity model comprises all velocity layers and volumes down to the top of salt, as well as the salt volume itself. The sediment-velocity model comprises all layers and volumes penetrated by the borehole and absent the salt structure. Structural information from borehole electrical logs was used in constructing both velocity models, with emphasis placed on using sediment-velocity changes, and structural-dip angles and azimuths from FMI dip processing. True 3-D dynamic ray tracing, which includes refraction at sedimentary boundaries defined within the models,3 was performed simultaneously in each model. The ray-traced, salt-face, refraction-point solutions are constrained by using total travel time from the first arrival, the computed arrival vector of that energy at the geophone, and the geometry of the source(s) and the borehole receiver(s). A single, best-solution point is determined for an intersection between the rays traced in each of the two models, within a defined accuracy, and that intersection point is at the location of the salt-to-sediment interface. Vermilion Bay well results. In the Vermilion Bay B93 well, data at 73 borehole salt-proximity stations were acquired, using a tuned airgun array and a borehole seismic-imaging tool containing 3-C gimbaled geophones. The source was located above, and roughly centered over, the top of the salt dome. The 3-D salt-proximity computation showed that location of the salt face was about 700 ft from the wellbore, rather than the expected 200 ft, Fig. 2. This measurement significantly increased reservoir size; it was later confirmed by pressure-transient analysis.
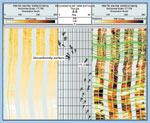
Confidence in the measurement accuracy was high, because multiple other salt-proximity computations had previously been proven accurate. Precision of 3-D salt-proximity measurements was enhanced, because depth and travel time to the salt top were precisely known from measurements made in a strategic well; it was located at the acoustic-source position at the top of the dome. This well had been drilled to penetrate the salt structure. It was from this well that the variation in salt velocity was confirmed using a downhole source inside the salt, with downhole receivers located in wells inside the salt structure near the outer edges of the salt. Wells were located near the outer edges so that they are almost opposite one another, with the downhole-source well near the center of the salt structure. Travel-time measurements yielded an average internal salt velocity of 14,700 fps in one direction and 15,373 fps in another direction. This velocity difference has been confirmed in many salt-proximity surveys performed in other wells around the structure, and through comparison of their results to seismic, production and well-control data. Formation Image Interpretation FMI, a wireline logging tool, was introduced in 1991. Its principle of measurement, an alternating current flowing through the formation between two electrodes, is the same as earlier dipmeter tools. The FMI has 192 sensor buttons, equally distributed, that provide 80% coverage of an 8-in. wellbore. In conductive drilling mud, the FMI generates an electrical image (a picture) of the borehole wall with 0.2-in. vertical resolution. The high resolution allows for interpretation of structural features such as: faults, fractures and unconformities; as well as stratigraphic features like bounding surfaces, pinch-outs, bedding and depositional-environment information. In the B93 well, FMI images were acquired in the 8,080 – 11,440-ft interval and processed for dips and images. Interpreters handpicked dips of the most significant bedding surfaces using a combined display of petrophysical data and enhanced micro-resistivity images, Fig. 3.
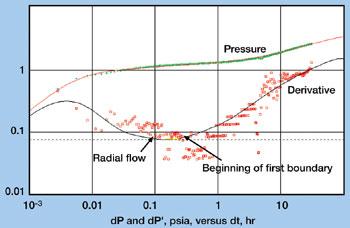
Interactive interpretation determined that there was no fault near the objective section. This determination was made based on lack of a significant scour surface exhibiting cross-bed truncations. Such a truncating surface is indicative of a vertically displaced section, i.e., a fault. Numerous faults were interpreted at other locations within the processed images. However, near the pay interval, significant surfaces were observed where bedding planes – and therefore dips – radically changed in both magnitude and azimuth, indicative of an unconformity in deposition. This image-based interpretation of an unconformity, rather than a fault, was later confirmed by the pressure-transient test interpretation. Well Testing A properly designed, executed and analyzed well test usually provides information about formation permeability, extent of stimulation or wellbore damage, reservoir pressure, and reservoir boundaries and heterogeneity. The basic test method is to create a pressure disturbance that travels inside the reservoir away from the wellbore. This disturbance is usually created by a designed production-rate change. In a buildup test, the well is shut-in. In a homogenous, infinite reservoir, the pressure wave travels radially away from the wellbore (radial flow). However, reservoir boundaries, such as a sealing fault, usually change the flow regime from radial to linear. From the time values required to reach linear flow, distance to that boundary can be estimated, as well as reservoir permeability and other rock / fluid properties. The B93 well test was designed to estimate the distance to nearby boundaries represented by the salt dome and a suspected fault. Reservoir permeability is the major factor affecting the test duration that is required to create pressure changes at some distance within the reservoir. An initial and relatively short buildup test was performed to get an estimate of reservoir permeability and pressure. This measured value of permeability was then used to modify the final extended-buildup test to insure enough time to detect reservoir boundaries. A graph of pressure / pressure derivative vs. time was used to diagnose flow regimes, Fig. 4. A radial-flow regime is usually diagnosed by zero slope (flat portion) on the derivative curve. Linear flow gives a slope of 0.5 on the derivative curve.4 The upper data set represents the buildup pressure, while the lower data set is the pressure derivative. Solid lines represent the reservoir analytical model that was used to match the data. Reservoir permeability, near-wellbore damage and distances to the three boundaries were varied to reach a better match to the data.
Results of the well test indicated two boundaries about 760 ft away from the wellbore and a third boundary at about 1,900 ft. No sealing boundaries were shown on the test less than 760 ft from the wellbore. This confirmed both the salt-proximity survey results and the image interpretation. Interpretation Results, Salt Model Visualization Well testing and FMI showed that some of the missing section previously thought to be faulting was actually an unconformity. Well testing and salt-proximity results delineated the updip reservoir boundary. Integration of all of these technologies indicated a much larger reservoir than structurally mapped and led to re-evaluation of the reservoir. This re-mapping significantly changed the geologic interpretation of the reservoir: It removed a large 450-ft fault and replaced it with an unconformity, extending the updip limit of the sand (gas cap) through better placement of the salt flank, Fig. 5.
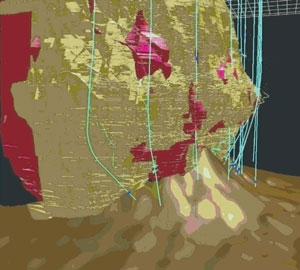
Interpretation techniques used at the B93 well have been added to a more extensive salt-structure evaluation, with emphasis on development drilling. Visualizing the salt dome required integrating attribute processing of 3-D seismic, well control and 3-D imaging to delineate the salt-structure flank. By adding 3-D salt-proximity survey answers from multiple wells around the salt structure, risk for future development drilling is significantly reduced. The visualization process began with a migrated 3-D seismic volume; five interpreted formation horizons; an interpretation of the salt flank (for comparison); three control wells having stratigraphic-marker information for the horizons; and salt-piercement information, where applicable. In addition, salt-proximity data from B93 – one of three control wells – was important to the process. The 4-mi2 seismic volume was processed and evaluated for a single, computed-attribute that yielded the most reliable and clear indication of sediment-to-salt-face truncations. A three-phase processing and interpretation procedure was performed at the completion of each phase, followed by evaluation of procedures used and the resulting interpretations. At completion of each phase, the new salt-face interpretation in the seismic, along with wellbore-control and seismic-horizon interpretation, was brought into a GeoViz 3-D visualization package. Proposed well trajectories were added, along with well-path controls and markers, and a complete analysis of the results was made using the 3-D volume. Project status. The project currently contains 31 well paths, 10 of which also include salt-proximity data, four that were prospective wells at some time in the project, and the remainder of which provide both positive and negative "salt-control" information. Formation-marker data is also used for all wells that penetrate either, or both, of the two major producing formations, in addition to salt entry and exit points, where applicable. Of the four prospective well paths evaluated in this project, three have been successfully drilled to their targets – all avoiding the salt with its associated risks. Recommendations. Based on interpretation of all available data, recommendations were made to alter well trajectories for three of these four prospective wells. The well paths were changed either to avoid salt or to improve their piercement location at the producing horizon(s). Two of the wells whose trajectories were changed were drilled without encountering salt, arriving at the producing horizon as predicted in the model. Based on success to date, two more wells are planned for 2000 in this field. Fig. 6 illustrates the accumulated interpretation results with the 3-D seismic removed. The gold and red solid represents two interpretations of salt structure, and the brown surface at the bottom is one of the target production horizons. Pale-blue lines represent existing boreholes.
Conclusion In mature fields, the use of integrated applied
technologies, such as those employed here, can greatly enhance reservoir characterization, which leads to
more-informed decision making and risk reduction. Many different technologies are available today that –
when interpreted and integrated into a single, whole perspective of the reservoir through 3-D visualization –
can produce a powerful tool for more efficient reservoir exploitation.
|
|||||||||||||||||||||||||||||||||||
- Applying ultra-deep LWD resistivity technology successfully in a SAGD operation (May 2019)
- Adoption of wireless intelligent completions advances (May 2019)
- Majors double down as takeaway crunch eases (April 2019)
- What’s new in well logging and formation evaluation (April 2019)
- Qualification of a 20,000-psi subsea BOP: A collaborative approach (February 2019)
- ConocoPhillips’ Greg Leveille sees rapid trajectory of technical advancement continuing (February 2019)

