Predicting surge pressures that result from running liners
CASING & TUBINGPredicting surge pressures that result from running linersNew computer program predicts surge pressures for different pipe end conditions when running liners in tight-tolerance wellbores and allows optimum tripping operationsGefei Liu, Pegasus Ventures, Inc., Houston
Excessive swab pressures may initiate a kick, while surge pressures are detrimental because they frequently are of large enough magnitude to fracture a formation. This is particularly true for ERD wells, slimhole and deepwater offshore drilling, because of restricted flow paths and limited number of casing and liners. The accurate prediction of surge and swab pressures is of great importance in wells where pressure must be maintained within narrow limits to ensure trouble-free drilling and completion operation. Introduction New drilling and completion technologies are challenging many aspects of our operations. For example, running liners in a subsea casing string with very tight tolerance can cause extremely high surge pressures. Auto-fill float equipment1,2 and other new tools, such as the flow diverter (also called circulation sub)3,4 have been developed to reduce the surge pressure, and they do show improvement. Factors to be determined are what the surge / swab pressures or optimal tripping speeds will be. To thoroughly analyze surge pressure, a comprehensive surge and swab hydraulics computer model SurgeMOD has been developed to assist in analysis and design of tripping operations, especially for deep water wells or wells using new tools such as auto-fill float equipment, circulation sub, etc. The program simulates fairly complex wellbore configurations, including multiple pipe sizes, wellbore intervals and annular sections with very tight tolerance. This article will review the engineering analysis behind trip operations for different pipe end conditions:
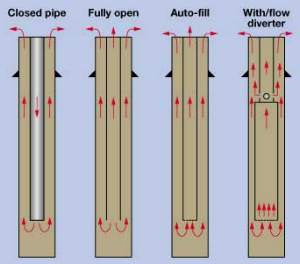
These four conditions are illustrated in Fig. 1. The author will discuss the controlling parameters affecting surge pressure using SurgeMOD. There are two aspects of the surge and swab pressure analysis – one is to predict surge and swab pressure for a given running speed (analysis mode), while the other one is to calculate optimal trip speeds at different string depths without breaking down formations or causing a kick at a weak zone (design mode). This article will address both issues. Examples of running liners in a tight tolerance wellbore will be analyzed.
Closed pipe. As pipe is moved downward into a well, the original mud is displaced by the new volume of the extending pipe and the mud must move upward. When the pipe is closed or contains a float sub, all displaced fluid passes up the annulus. Flowrate in annulus is equal to pipe displacement rate. It is therefore easy to calculate the frictional pressure drop in the annulus. Surge pressure is calculated using standard hydraulics equations. However, the equations have to be modified to account for movement of the pipe wall. Fully open pipe. If the pipe is open-ended, the problem gets more complicated, since the distribution of flow between inside pipe and annulus cannot be determined by any simple method. A split of flow going to the annulus and pipe interior is iteratively calculated. A numerical method must be used to make sure that the summation of resulting frictional pressure drops inside the pipes is equal to that of all annular sections. Auto-fill or pipe with nozzle. The difference between auto-fill float equipment and a fully open pipe is due to the additional pressure drop across the orifices on auto-fill float equipment. Depending on the total flow area of auto-fill equipment, the resulting surge pressure can vary significantly. The actual surge pressure should be between those of closed pipe and fully open pipe. Pipe with flow diverter. A new tool, commonly referred to as flow diverter valve or circulation sub, has been developed that is used in conjunction with auto-fill float equipment. This tool, located on drill pipe immediately above the liner, has ports open to the drill pipe annulus. These ports allow the fluid trapped in the liner to escape from the narrow drill pipe interior to the larger annulus between drill pipe and casing. Equipped with this tool, the system now has two places of fluid communication between pipe interior and annulus – one at the bottom of the liner (auto-fill float equipment), the other at the top of the liner (circulation sub). Displaced fluid seeks the least resistance to flow. This device will help reduce the surge pressure, depending on the wellbore configurations and location of the flow diverter tool. Discussion and Case Study Surge and swab pressures were studied as early as 1934.5 Since then, many researchers have used different approaches to predict surge and swab pressures. The most common approaches are using steady flow models, such as those proposed by Burkhardt,6 Fontenot and Clark,7 and Schuh.8 Lubinski,9 Lal10 and Mitchell11 used dynamic models to predict surge pressures. Generally speaking, the steady flow model is conservative in nature and normally does not consider the following three factors:
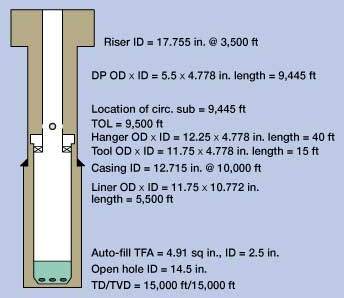
Dynamic surge models, while giving less conservative predictions, are more complex and require not only more input data, which may not be readily available to engineers, but also more computer resources. In this study, an improved steady flow model, SurgeMOD, is employed. One of the improvements is the correct calculation of the mud clinging constant. The mud clinging constant represents the proportion of pipe velocity that must be added to fluid velocity to find the equivalent or effective velocity that can be used in the stationary annulus calculation. In the oil field, it is common practice to assume a clinging constant of – 0.45; but it is shown that this can be considerably in error.12 The model calculates the correct mud clinging constant, based on the ratio of pipe diameter to hole diameter. Numerical methods are employed to obtain the correct flow split percentage when there are communications between pipe interior and annulus. The flow split is chosen such that the sum of hydrostatic and frictional pressures in the pipe interior and through the bit (auto-fill float equipment) should equal the sum of hydrostatic and frictional pressures in the annulus.12, 13 Most drill pipe in common usage has an internal upset and a larger OD at each tool joint. The model takes into account additional pressure losses caused by tool joint restrictions. Fig. 2 shows the wellbore configuration used for the example calculation. The riser (ID = 17.755 in.) depth is 3,500 ft. The casing (ID = 12.715 in.) is set at 10,000 ft. Open hole diameter was 14.5 in. TD of this vertical well is 15,000 ft. Mud weight is 11 ppg with plastic viscosity of 20 cp and yield point of 15 lb/100ft2. The weak zone is at 15,000 ft, with pore and fracture pressure gradient of 9.5 ppg and 12 ppg, respectively.
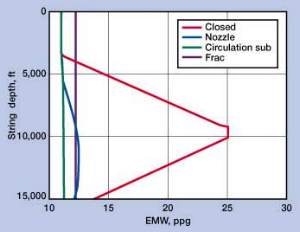
The goal is to run 5,500 ft of liner (11-3/4-in. OD, 60 ppf, 10.772-in. ID) to bottom. The auto-fill float equipment has an orifice with a total flow area (TFA) of 4.91 sq in. The challenge is to run the liner through the casing and openhole section without fracturing the formation. Note that the annular radial clearance between casing and liner is 0.4825 in. Analysis mode. First step is to use the analysis mode of the model to calculate surge and swab pressures for a given tripping speed. Fig. 3 shows the simulated bottomhole equivalent mud weight (EMW) vs. liner depth during the trip-in operation at 180 fpm (3 fps). Obviously, if the pipe is closed at the end, lost circulation would occur when the liner reaches 4,000 ft. For a liner with auto-fill float equipment (TFA = 4.91 sq in.), it could go as deep as 8,400 ft without fracturing the formation.
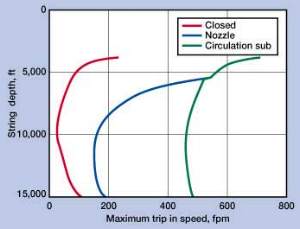
If a circulation sub is placed above the liner, this trip speed would be safe for the entire wellbore. EMWs for both closed and open pipe decrease after the pipe passes 10,000 ft due to the larger ID of the open hole section. It can be noted that a certain tripping speed may be safe at TD, but it would have already fractured the formation before it reaches TD. Design mode. The next step is to predict the optimal tripping speeds at various string depths. Optimal tripping speed is the maximum pipe running speed without fracturing the formation or causing a kick at a weak zone. Fig. 4 shows the optimal tripping speeds for different pipe end conditions at various depths. As can be seen from this graph, engineers must pay close attention before the pipe reaches 10,000 ft. At 10,000 ft, the narrowest annular section is the longest, therefore producing the maximum surge pressure. When the liner enters the larger openhole section, trip speeds can be increased. The most dangerous string depth is not necessarily at the bottom of the well. Note also that the curves for pipe with auto-fill float equipment (labeled "nozzle" in Fig. 4) and pipe with a circulation sub coincide above string depth of 5,555 ft. This is because above that depth, the circulation sub, which is located at 9,445 ft, is not inside the wellbore.
Sensitivity analysis. Fig. 5 shows the sensitivities of surge pressures to tripping speeds for the following pipe ending conditions:
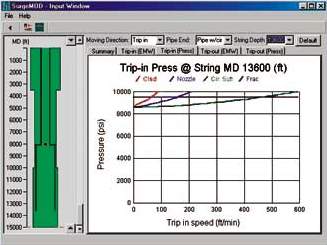
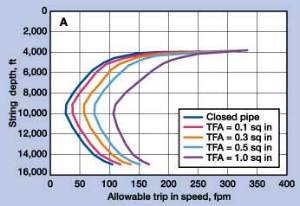
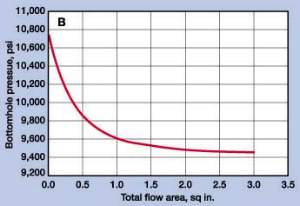
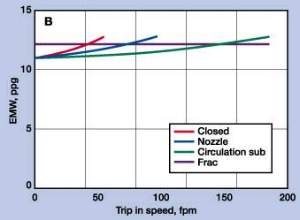
The model program is equipped with pipe moving animation, so the user can view the positions of the pipe and pressure variation simultaneously. Fig. 5 is for the sensitivity of surge pressures at 13,600 ft. As tripping speed increases, the surge pressure for closed pipe increases sharply and surge pressure for the pipe with a circulation sub gradually increases. The curve for the pipe with auto-fill float equipment lies between them. Effects of total flow area (TFA) of auto-fill float equipment. Having noted that the pipe end conditions have great effects on surge pressures, the next step is to determine how the total flow area of auto-fill float equipment affects the surge pressure for open-ended pipes. Fig. 6A shows the optimal trip-in speeds vs. string depths for various TFAs. As the TFA of auto-fill float equipment increases, the optimal trip-in speed curve shifts to the right, allowing greater trip-in speed. The reason for this shifting is that the large TFA allows the fluid to move into the pipe interior more freely, reducing the amount of fluid flowing into the annulus. This redistribution of flow reduces the overall frictional pressure drop along the flow paths inside the pipe and outside in the annulus. Fig. 6B shows the influence of TFA on the bottomhole surge pressure. Zero TFA corresponds to closed pipe. The sharp surge pressure drop, accompanying the TFA increase, results from the redistribution of flow between the pipe interior and the annulus. Between closed pipe and TFA of 1 sq in., the increase of TFA improves the surge pressure significantly. However, for the case shown, TFA greater than 2 sq in. reduces the bottomhole surge pressure marginally.
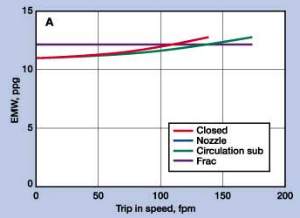
Nevertheless, the TFA of auto-fill float equipment is very important if it is used in conjunction with a circulation sub. Fig. 7 compares the situations with two TFAs. Fig. 7A is the simulated results of a case with TFA of 0.3 sq in., while Fig. 7B is with TFA of 3 sq in. Here, the TFA of 0.3 sq in. represents either improper design of auto-fill float equipment or auto-fill equipment obstructed by cuttings.
The advantages of a circulation sub with auto-fill float equipment having a large TFA, as shown in Fig.7B, do not show up in Fig. 7A, where the auto-fill float equipment TFA is only 0.3 sq in. This is not surprising, because if the fluid were restricted at the entrance of the liner, the circulation sub at the top of the liner would not be able to divert enough fluid into the annulus. Therefore, the benefits of the circulation sub depend on the sufficient TFA of auto-fill float equipment. New generation of auto-fill float equipment is available with a TFA of 10 sq in. TFA of this magnitude helps to insure sufficient flow area to reduce the possibility of plugging with formation cuttings. Conclusions Following are conclusions regarding the engineering analysis of surge pressure:
Literature Cited 1 Weatherford International, Inc., Float and Stage Equipment Brochure, Brochure #67. 2 Davis-Lynch, Inc., Equipment Catalog #20, page 1. 3 Baker Oil Tools, Hyflo Diverter Valve Product Report, April 28, 2000. 4 V. H. Goodwin and J. P. Allamon, "Surge Reduction on Closed Tolerance Liners and Subsea Casing Strings: Innovation through Execution," SPE/IADC Drilling Conference, Amsterdam, the Netherlands, February 2001. 5 Cannon, George E., "Changes in Hydrostatic Pressure Due to Withdrawing Drill Pipe from the Hole," Drilling And Production Practices, API (1934). 6 Burkhardt, J. A., "Wellbore Pressure Surges Produced by Pipe Movement," J. Pet. Tech. (June 1961). 7 Fontenot, J. E., and Clark, R. K., "An Improved Method for Calculating Swab and Surge Pressure and Calculating Pressures in a Drilling Well," Soc. Pet. Eng. J. (October 1974). 8 Schuh, F. J., "Computer Makes Surge-Pressure Calculations Useful," Oil and Gas Journal, (August 1964). 9 Lubinski, A., Hsu, F. H., and Nolte, K. G., "Transient Pressure Surges Due to Pipe Movement in an Oil Well," revue de L’Inst. Fran. Du Pet. (May – June 1977). 10 Lal, Manohar, "Surge and Swab Modeling for Dynamic Pressure and Safe Trip Velocities," Proceedings, 1983 IADC/SPE Drilling Conference, New Orleans, (1983). 11 Mitchell, R. F., "Surge Pressure: Are Steady-State Models Adequate?" Proceedings, SPE 63rd Annual Technical Conference, Houston, TX October 1988. 12 Exlog Staff, "Theory and Application of Drilling Fluid Hydraulics," The Exlog Series of Petroleum Geology and Engineering Handbooks, 1985. 13 Bourgoyne, A. T., Jr., et al, "Applied Drilling Engineering," SPE, (Richardson 1986).
|
||||||||||||||||||||||||||||||